
ljn
Comparisons
A technical comparison of OpenTelemetry → Kafka → ClickHouse vs OpenTelemetry → GlassFlow → ClickHouse. Learn where Kafka adds real value and where it adds operational overhead your observability pipeline doesn't need.
Written by
Armend Avdijaj
-
ClickHouse has become one of the most popular databases for observability. It ingests and queries high-volume logs, traces, and metrics quickly, without the cost profile of hosted platforms. OpenTelemetry has become the standard collection layer for modern applications. For most teams, building an OpenTelemetry ClickHouse pipeline is no longer the question. The question is what should sit between them.
For years, Kafka has been the default answer. It solves real problems: buffering, backpressure, replay, and fan-out to multiple consumers. But Kafka also brings brokers, topics, partitions, storage management, consumer lag, and a much larger operational surface. For many startups and mid-sized teams, that's more infrastructure than the telemetry pipeline actually needs.
This article compares the traditional OpenTelemetry → Kafka → ClickHouse architecture with a simpler OpenTelemetry → GlassFlow → ClickHouse approach and discusses where to use each, and how GlassFlow's native OTLP ingestion delivers clean, ClickHouse-ready telemetry without operating a Kafka cluster.
1. OpenTelemetry to ClickHouse: Architecture Options
Both architectures solve the same core problem: getting OpenTelemetry telemetry into ClickHouse reliably and at scale. The difference is in how much infrastructure sits between collection and storage, and how much operational complexity teams are willing to manage.
Kafka-based pipelines treat telemetry as a general-purpose event stream. This provides durability and flexibility, but it also introduces additional infrastructure that teams need to operate and scale. GlassFlow takes a more focused approach by simplifying the ingestion and processing layer specifically for ClickHouse observability pipelines.
OpenTelemetry -> Kafka -> ClickHouse

Figure 1: How Telemetry data flows from Applications to ClickHouse with Kafka
In a traditional architecture, OpenTelemetry Collectors receive telemetry from applications and infrastructure and forward that data into Kafka topics. Separate consumers then read from Kafka, process the events, and insert them into ClickHouse.
This model is widely used because Kafka provides strong durability and decoupling between producers and downstream systems. Teams can buffer traffic spikes, replay historical telemetry, support multiple consumers, and isolate ClickHouse from sudden ingestion bursts. This becomes especially valuable in very large environments where telemetry may feed multiple systems beyond observability storage.
The trade-off is operational complexity. Even a relatively small observability pipeline now includes Kafka brokers, partitions, replication management, storage planning, consumer coordination, monitoring, upgrades, and lag management. In many organizations, maintaining the telemetry infrastructure itself becomes a significant operational responsibility.
Despite this, the OpenTelemetry Kafka ClickHouse stack remains the most widely referenced architecture for high-volume telemetry pipelines, and for good reason in large-scale environments.
OpenTelemetry -> GlassFlow -> ClickHouse

Figure 2: How the architecture changes with GlassFlow in the middle
With GlassFlow, OpenTelemetry Collectors send OTLP telemetry directly into GlassFlow, which processes and delivers the data into ClickHouse.
Instead of treating telemetry as a generic event stream, GlassFlow focuses specifically on observability ingestion and stream processing for ClickHouse. Processing tasks such as filtering, enrichment, deduplication, schema normalization, masking, and batching happen before the data reaches ClickHouse.
This significantly reduces the number of moving parts in the pipeline. Teams do not need to operate Kafka clusters or build separate consumer services purely for telemetry ingestion. The result is a more focused architecture with lower operational overhead, simpler deployment, and faster end-to-end ingestion into ClickHouse.
Where the OpenTelemetry Collector Fits
Component | Role in the Pipeline |
|---|---|
OpenTelemetry Collector | Receives telemetry from applications and infrastructure |
Protocol Handling | Standardizes telemetry using OTLP and other supported formats |
Lightweight Processing | Handles batching, retries, sampling, and basic filtering |
Routing Layer | Forwards telemetry downstream to Kafka or GlassFlow |
Common Entry Point | Provides a consistent ingestion layer across both architectures |
Where GlassFlow Fits
Responsibility | How GlassFlow Helps |
|---|---|
OTLP Ingestion | Receives telemetry directly from OpenTelemetry Collectors |
Stream Processing | Applies filtering, enrichment, deduplication, and masking in real time |
Schema Normalization | Prepares telemetry in a ClickHouse-friendly format |
ClickHouse Optimization | Handles batching and delivery optimized for ClickHouse ingestion |
Infrastructure Simplification | Removes the need for Kafka clusters and custom consumer services |
Pipeline Focus | Provides a processing layer designed specifically for observability workloads |
2. Performance Comparison: Kafka vs GlassFlow for ClickHouse Ingestion
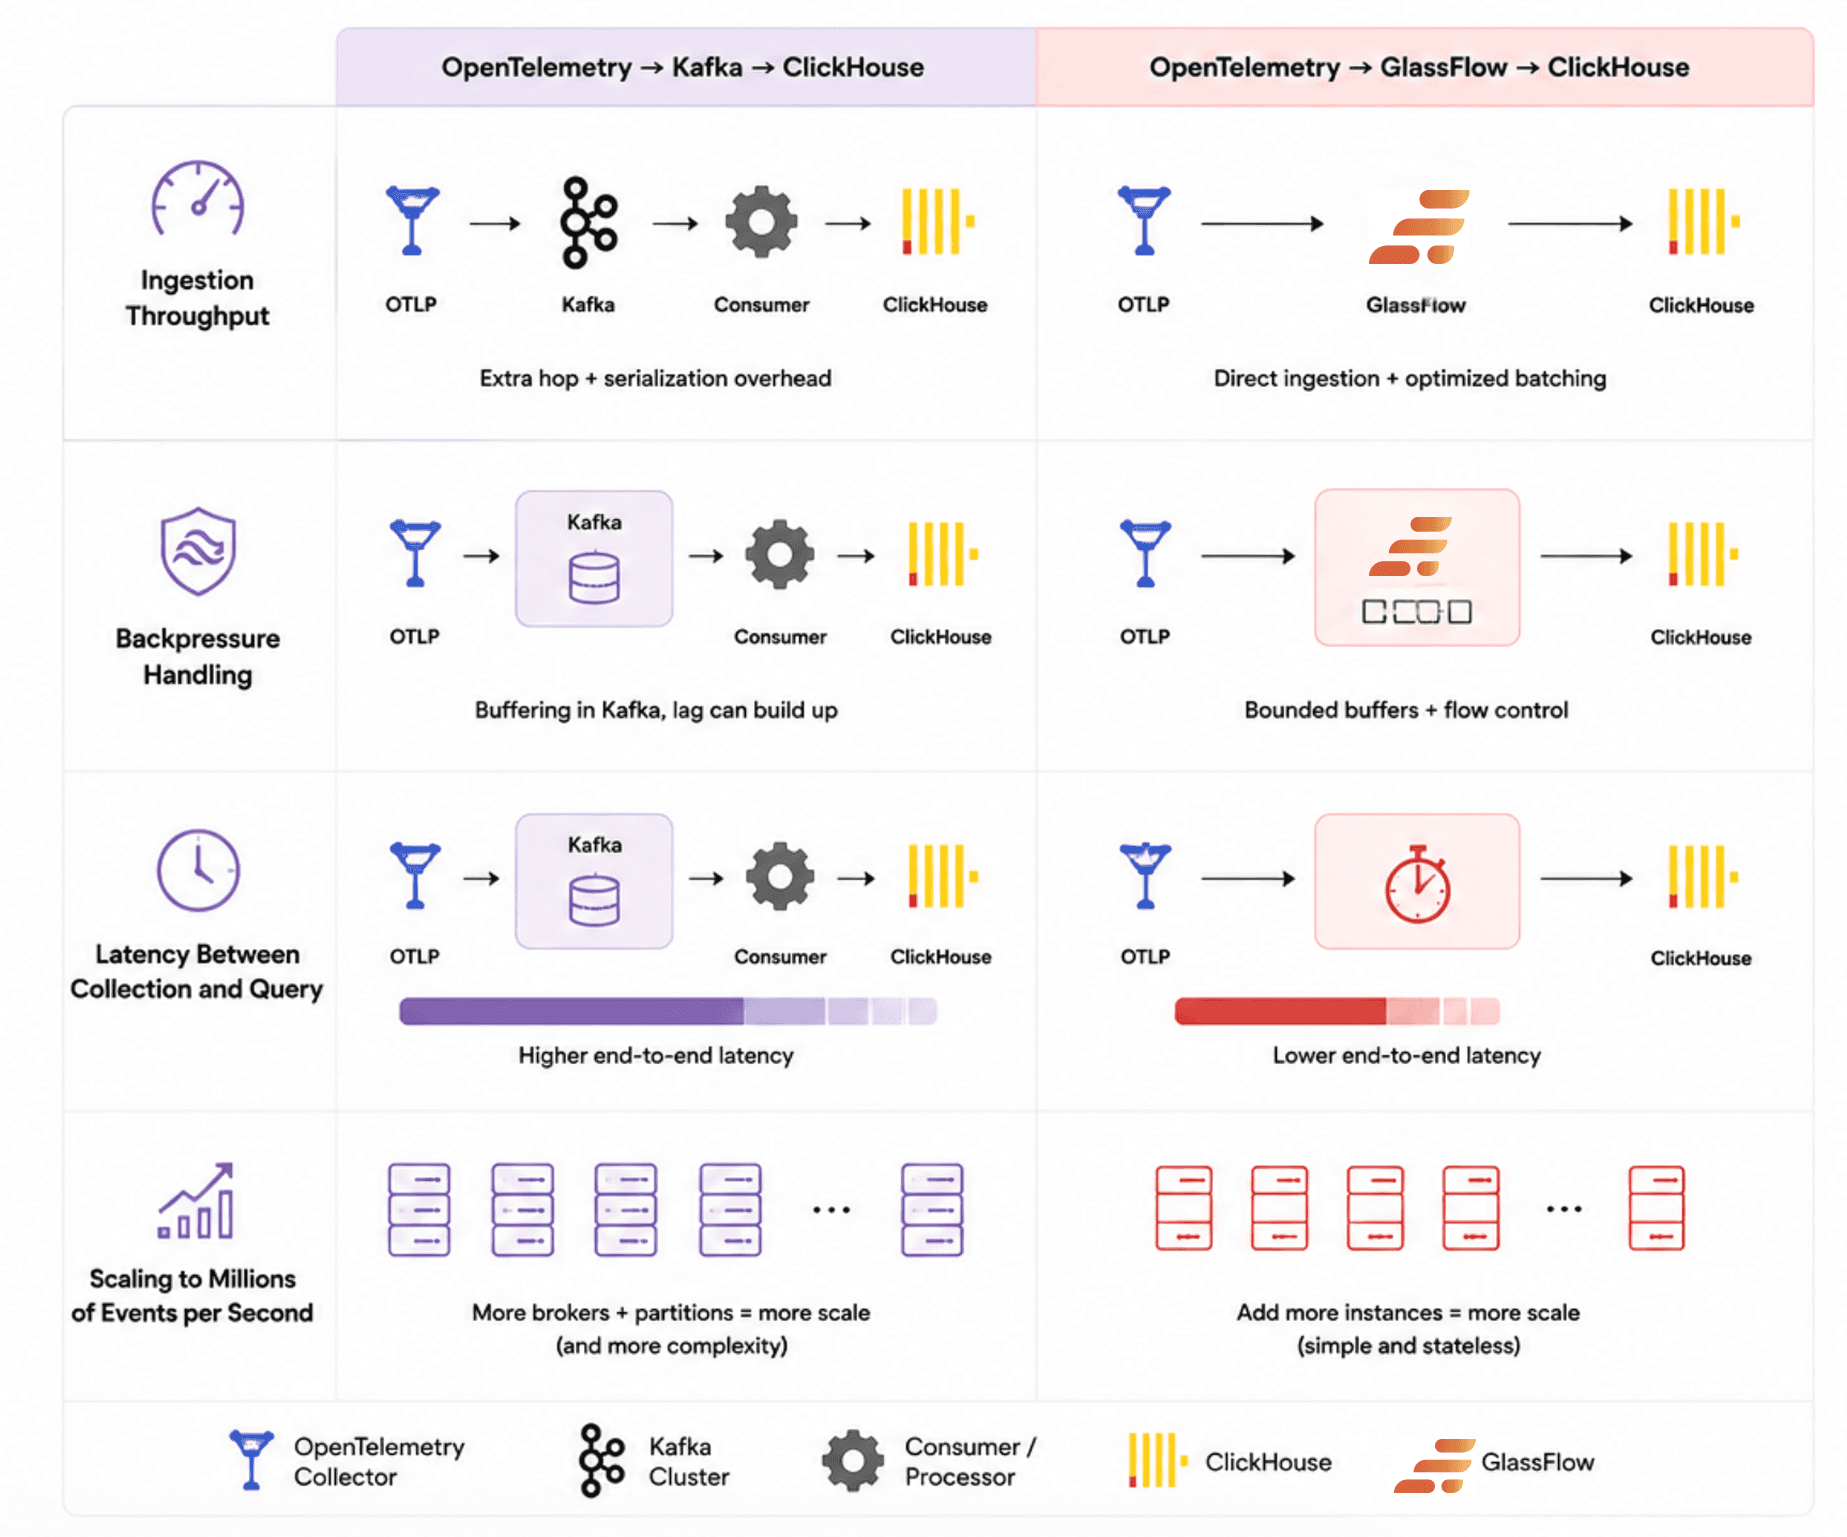
Figure 3. Performance and Scale Comparison between the two approaches
Performance requirements in observability pipelines are very different from traditional transactional systems. Telemetry pipelines must handle large ingestion spikes, continuous high-throughput writes, and low-latency delivery into analytics storage.
Both Kafka and GlassFlow can scale to support high-volume telemetry workloads, but they approach scaling, buffering, and processing very differently.
Ingestion Throughput
Kafka is built for extremely high-throughput event streaming and can comfortably handle millions of events per second when properly partitioned and scaled. Large organizations often use Kafka because it can support many independent consumers while maintaining durable ingestion.
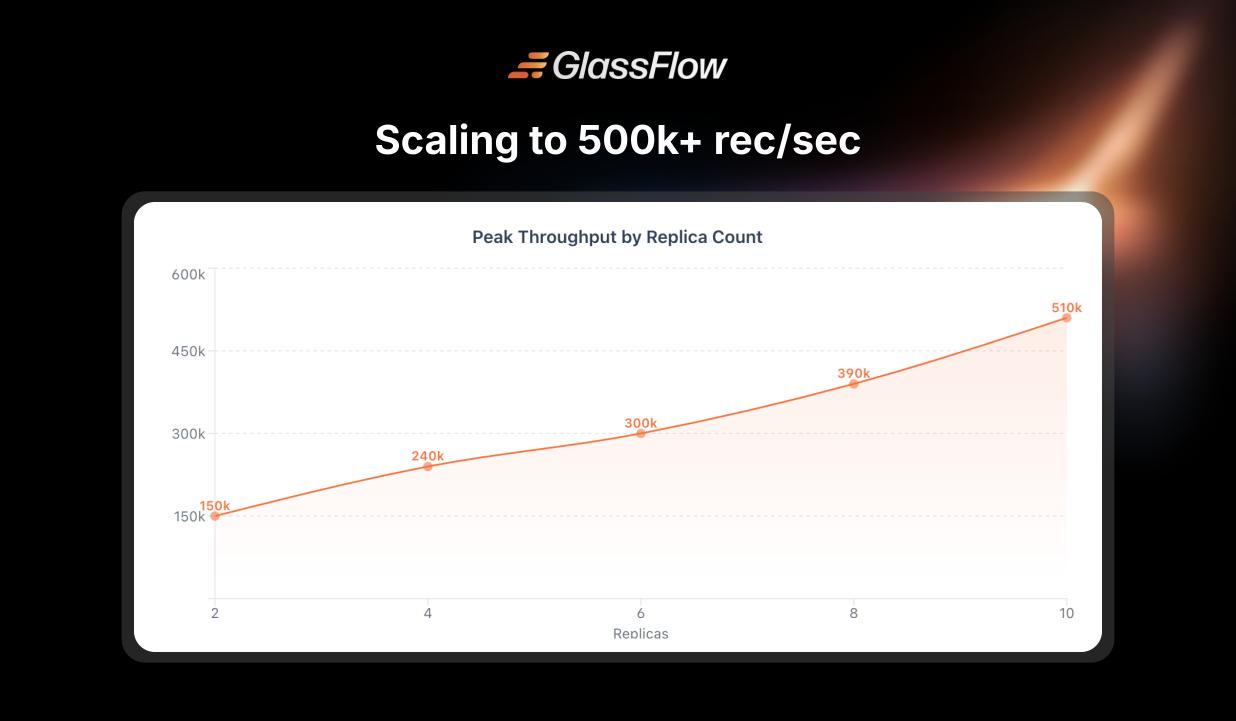
GlassFlow focuses specifically on high-throughput telemetry delivery into ClickHouse. Recent GlassFlow benchmarks demonstrate sustained scaling beyond 500,000 events per second within a single pipeline while still performing transformations and ClickHouse delivery.
Instead of optimizing for general-purpose event streaming, GlassFlow optimizes for observability processing tasks such as filtering, enrichment, batching, deduplication, and efficient ClickHouse inserts. For most observability workloads, this provides more than enough throughput while keeping the overall pipeline significantly simpler to operate.
Backpressure Handling
Kafka naturally absorbs ingestion spikes because events are durably stored inside partitions until consumers catch up. This provides strong buffering guarantees during downstream slowdowns or ClickHouse maintenance windows. This approach works especially well for large multi-consumer systems where telemetry must remain durable for long periods or be replayed later across different downstream applications.
GlassFlow handles backpressure through a propagation model built into the pipeline chain: Source → Ingest → NATS buffer → Transforms → Sink → ClickHouse. Backpressure originates at whichever stage is slowest (in practice, almost always the sink writing to ClickHouse) and propagates upstream from there.
When ClickHouse can't accept inserts fast enough, the sink drains the internal NATS buffer more slowly than new data arrives. Once the NATS stream hits its capacity limit, the ingest layer reacts depending on the source type. For Kafka pipelines, the ingestor stops consuming from Kafka and retries until the buffer drains — Kafka itself holds the data, so nothing is lost. For OTLP pipelines, GlassFlow returns 429 Too Many Requests to the upstream OTel Collector or SDK. Standard exporters handle this automatically by retrying and holding data on their side until GlassFlow recovers.
Either way, data waits outside GlassFlow rather than being silently dropped. The usual resolution when backpressure is sustained is to scale the sink with more replicas or increase ClickHouse capacity. Compared to Kafka's large persistent buffer model, GlassFlow's approach is more tightly coupled to the throughput of ClickHouse, which is the right trade-off for observability pipelines where the goal is fast delivery into storage rather than long-term event retention.
Latency Between Collection and Query
Kafka pipelines often introduce additional latency because telemetry passes through multiple stages before reaching ClickHouse. Data must be written to Kafka, consumed by downstream processors, transformed, and then inserted into storage. While this extra layer improves durability and decoupling, it also increases the time between telemetry collection and query availability. For systems prioritizing long-term buffering and replay, this trade-off is often acceptable.
GlassFlow reduces this path by processing telemetry directly after collection and delivering optimized batches into ClickHouse. With fewer infrastructure layers and processing hops, teams typically achieve lower end-to-end ingestion latency. This model works particularly well for observability platforms where fast querying and operational simplicity are more important than long-term event retention.
Scaling to Millions of Events per Second
Kafka remains one of the strongest choices for extremely large-scale event streaming systems with many downstream consumers and long retention requirements. Large enterprises commonly use Kafka to centralize telemetry, analytics, and event-driven applications within the same platform. At very large scale, Kafka’s partitioned architecture provides massive horizontal scalability, but this also introduces additional operational responsibilities around brokers, replication, balancing, and storage management.
GlassFlow scales differently by focusing specifically on observability ingestion and ClickHouse delivery. Recent benchmarks demonstrate sustained throughput beyond 500,000+ events per second while still performing real-time transformations and ClickHouse delivery. For teams primarily building telemetry pipelines rather than organization-wide streaming platforms, GlassFlow provides a simpler scaling model with significantly lower operational overhead while still supporting substantial production-scale observability workloads.
3. Cost & Operational Complexity
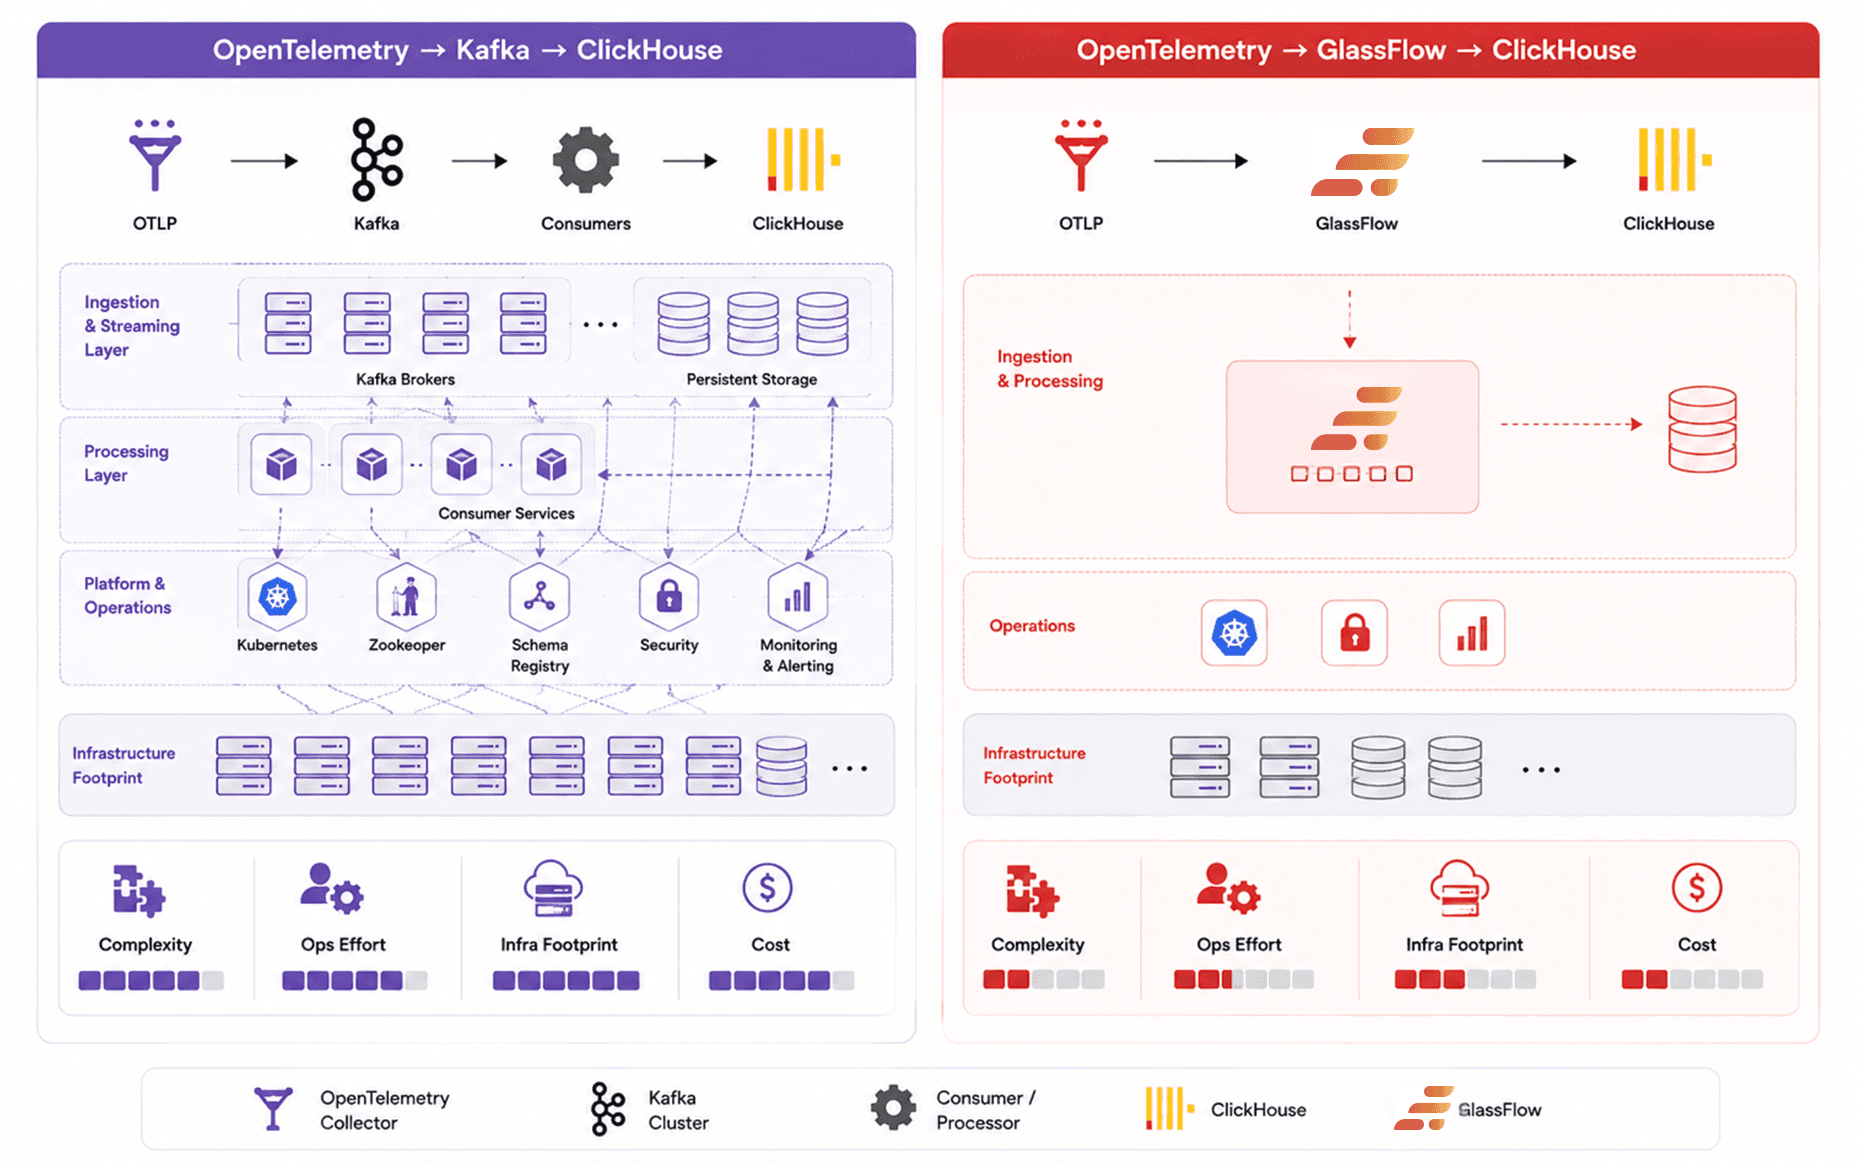
Figure 4. How do the Cost and Complexity come into play for both these architectures?
For many teams, the biggest difference between these architectures is not throughput or latency, but operational cost. Running observability pipelines at scale involves infrastructure, storage, monitoring, upgrades, and day-two maintenance.
Kafka provides significant flexibility and durability, but that flexibility comes with a much larger operational footprint. GlassFlow focuses on reducing the amount of infrastructure required specifically for observability ingestion into ClickHouse.
Kafka Infrastructure Cost
A production Kafka deployment typically requires multiple brokers, replication, persistent storage, monitoring infrastructure, and consumer services. As ingestion volume grows, teams also need to manage partition scaling, storage retention, and cluster balancing.
For organizations already operating Kafka for broader event streaming workloads, this overhead may be acceptable. But for teams using Kafka primarily as a telemetry buffer before ClickHouse, infrastructure and operational costs can grow quickly. A Kafka ClickHouse pipeline built solely for observability ingestion often carries more infrastructure weight than the workload actually justifies.
GlassFlow Infrastructure Cost
GlassFlow removes the need to operate dedicated Kafka infrastructure for observability pipelines. Instead of managing brokers and consumer services, teams can process and deliver telemetry using a smaller and more focused ingestion layer.
This reduces infrastructure requirements, operational overhead, and engineering time spent maintaining telemetry-specific streaming systems. Moreover, the infrastructure has been built to scale effectively with minimal downtime to the application.
Kubernetes and Deployment Complexity
Kafka deployments in Kubernetes often require additional operators, persistent volumes, replication configuration, broker coordination, and careful upgrade planning. Even managed Kafka services still require topic management, scaling decisions, and consumer monitoring.
GlassFlow simplifies deployment by reducing the number of infrastructure components involved in the ingestion pipeline and only has a single command deployment functionality. Teams can scale observability pipelines without also managing a distributed event streaming platform.
Day-Two Operations
The operational burden of Kafka typically appears after the initial deployment. Teams need to monitor consumer lag, rebalance partitions, handle broker failures, manage storage growth, and maintain cluster health over time.
GlassFlow reduces much of this operational surface area by focusing specifically on telemetry processing and ClickHouse delivery. For many observability-focused teams, this results in simpler operations and lower long-term maintenance overhead.
4. Data Processing Before ClickHouse: What Kafka Can't Do Alone
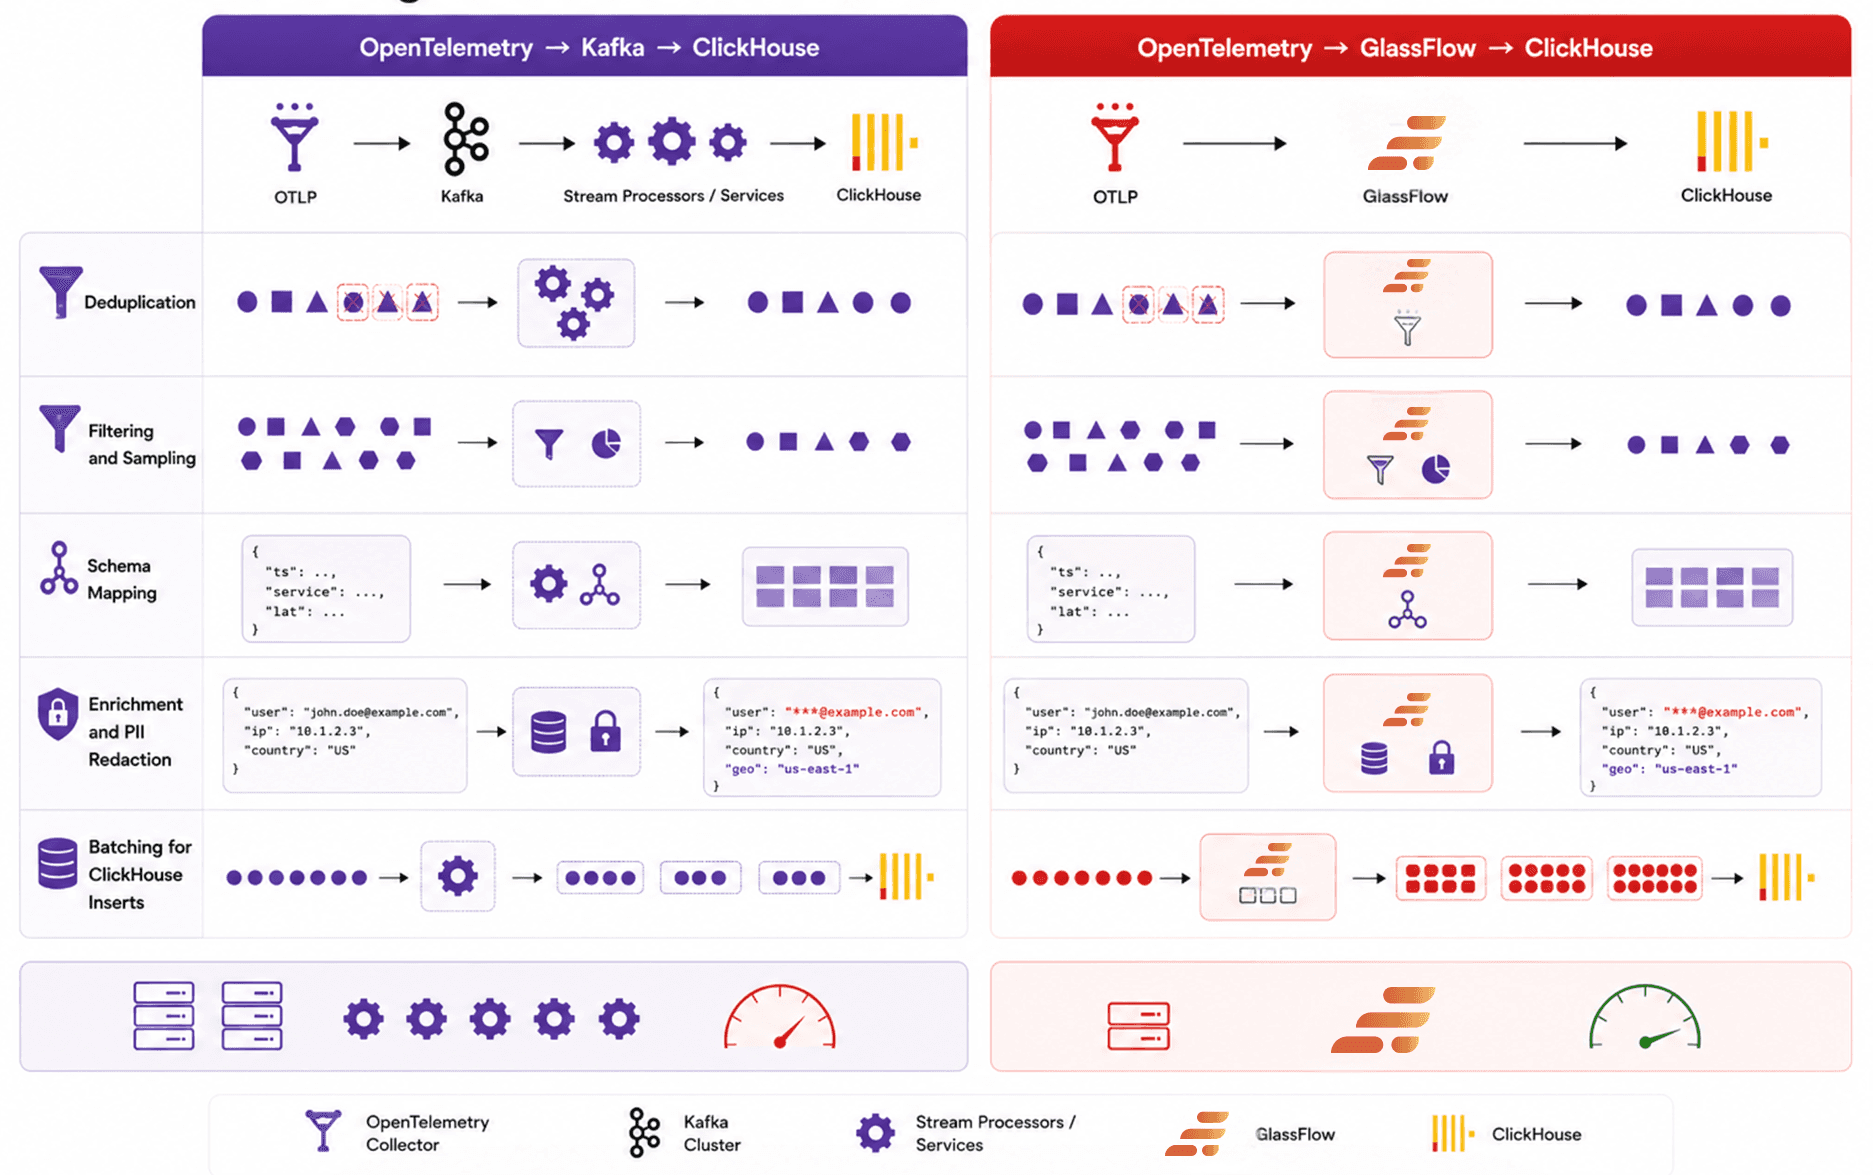
Figure 5. How both approaches handle processing and delivery challenges
Getting telemetry into ClickHouse is only part of the challenge. Raw OpenTelemetry data often needs additional processing before it becomes efficient to store and query at scale.
This is where the difference between a general-purpose streaming platform and an observability-focused ingestion layer becomes much more visible (i.e. GlassFlow shines). Kafka provides the foundation for building processing pipelines, but teams typically still need additional consumers, stream processors, or custom services to make telemetry truly ClickHouse-ready.
GlassFlow focuses directly on this processing layer by handling common observability transformations before the data reaches ClickHouse.
Filter Type | OTel Collector | GlassFlow |
|---|---|---|
Attribute matching | ✅ Drop spans where | ✅ |
Log severity thresholds | ✅ Drop logs below | ✅ |
Probabilistic sampling | ✅ Keep 10% of traces by trace ID | ✅ |
Stateful deduplication | ❌ | ✅ Drop spans already seen within a time window using composite keys |
Enrichment-conditional filtering | ❌ | ✅ Drop events only after enrichment reveals they belong to non-production |
Dynamic sampling | ❌ | ✅ Adjust rates based on real-time error rates, not static percentages |
Cross-signal filtering | ❌ | ✅ Suppress metrics from services with no active traces in the last N minutes |
PII-conditional filtering | ❌ | ✅ Remove events where redacting required fields would make the record useless |
The result is a pipeline where only high-value telemetry reaches ClickHouse rather than just what the Collector can statically exclude at the edge, but what downstream context and stream state reveal as low-signal or redundant.
Deduplication
Duplicate telemetry is common in distributed systems due to retries, collector restarts, network interruptions, and at-least-once delivery patterns. Additionally, the same span batch can be emitted multiple times, making relying on the spanID insufficient. If duplicates are not removed before ingestion, they can increase ClickHouse storage costs and distort observability queries.
In Kafka-based pipelines, deduplication is usually implemented using Kafka Streams, Flink, Spark Streaming, or custom consumer services. This provides flexibility, but it also introduces additional infrastructure and state management complexity.
GlassFlow includes built-in stream processing capabilities for handling telemetry deduplication directly within the ingestion pipeline. For observability workloads, this reduces the need for separate processing services while keeping data cleaner before it reaches ClickHouse.
Filtering and Sampling
Not all telemetry needs to be stored permanently. High-cardinality debug logs, repetitive traces, and noisy infrastructure metrics can quickly increase ingestion volume and ClickHouse storage costs.
The OpenTelemetry Collector already provides basic filtering such as dropping spans by status code, sampling traces probabilistically, or excluding logs below a certain severity level. These filters are intentionally lightweight because the Collector runs close to the application and cannot carry state or make decisions based on enriched or cross-signal context.
GlassFlow applies filtering and sampling further downstream, where more context is available. This allows teams to apply logic that would be too expensive or too complex for the Collector to handle and to reduce ingestion volume before data reaches ClickHouse rather than after.
Schema Mapping
OpenTelemetry data is flexible, but ClickHouse performs best with carefully designed schemas optimized for analytics workloads. Raw telemetry often requires normalization, flattening, and restructuring before insertion.
With Kafka-based architectures, schema transformation is typically handled inside downstream processing applications. Teams frequently maintain custom mapping logic to ensure telemetry aligns correctly with ClickHouse table structures.
GlassFlow simplifies this step by processing telemetry in a ClickHouse-aware ingestion layer. Schema normalization and mapping happen before insertion, helping teams avoid additional transformation services between collection and storage.
Enrichment and PII Redaction
Observability pipelines often need additional context added to telemetry before storage. Teams may enrich events with environment metadata, deployment details, geographic information, or ownership tags.
At the same time, sensitive information such as emails, IP addresses, tokens, or user identifiers may need to be masked or removed before data reaches storage systems.
In Kafka pipelines, enrichment and redaction are commonly implemented using stream processing frameworks or custom middleware services. GlassFlow handles these transformations directly within the ingestion pipeline, allowing teams to apply enrichment and masking closer to the point of ingestion with fewer moving parts.
Batching for ClickHouse Inserts
ClickHouse performs best when data is inserted in properly sized batches rather than individual events. Efficient batching improves compression, reduces merge pressure, and increases overall ingestion throughput.
Kafka-based pipelines usually require downstream consumers to manage buffering and insert batching manually before writing to ClickHouse. This adds additional tuning around flush intervals, memory usage, and consumer throughput.
GlassFlow optimizes batching specifically for ClickHouse ingestion patterns. By handling buffering and batch delivery within the ingestion layer itself, it simplifies pipeline design while improving write efficiency into ClickHouse.
5. Ecosystem & Reliability Trade-Offs
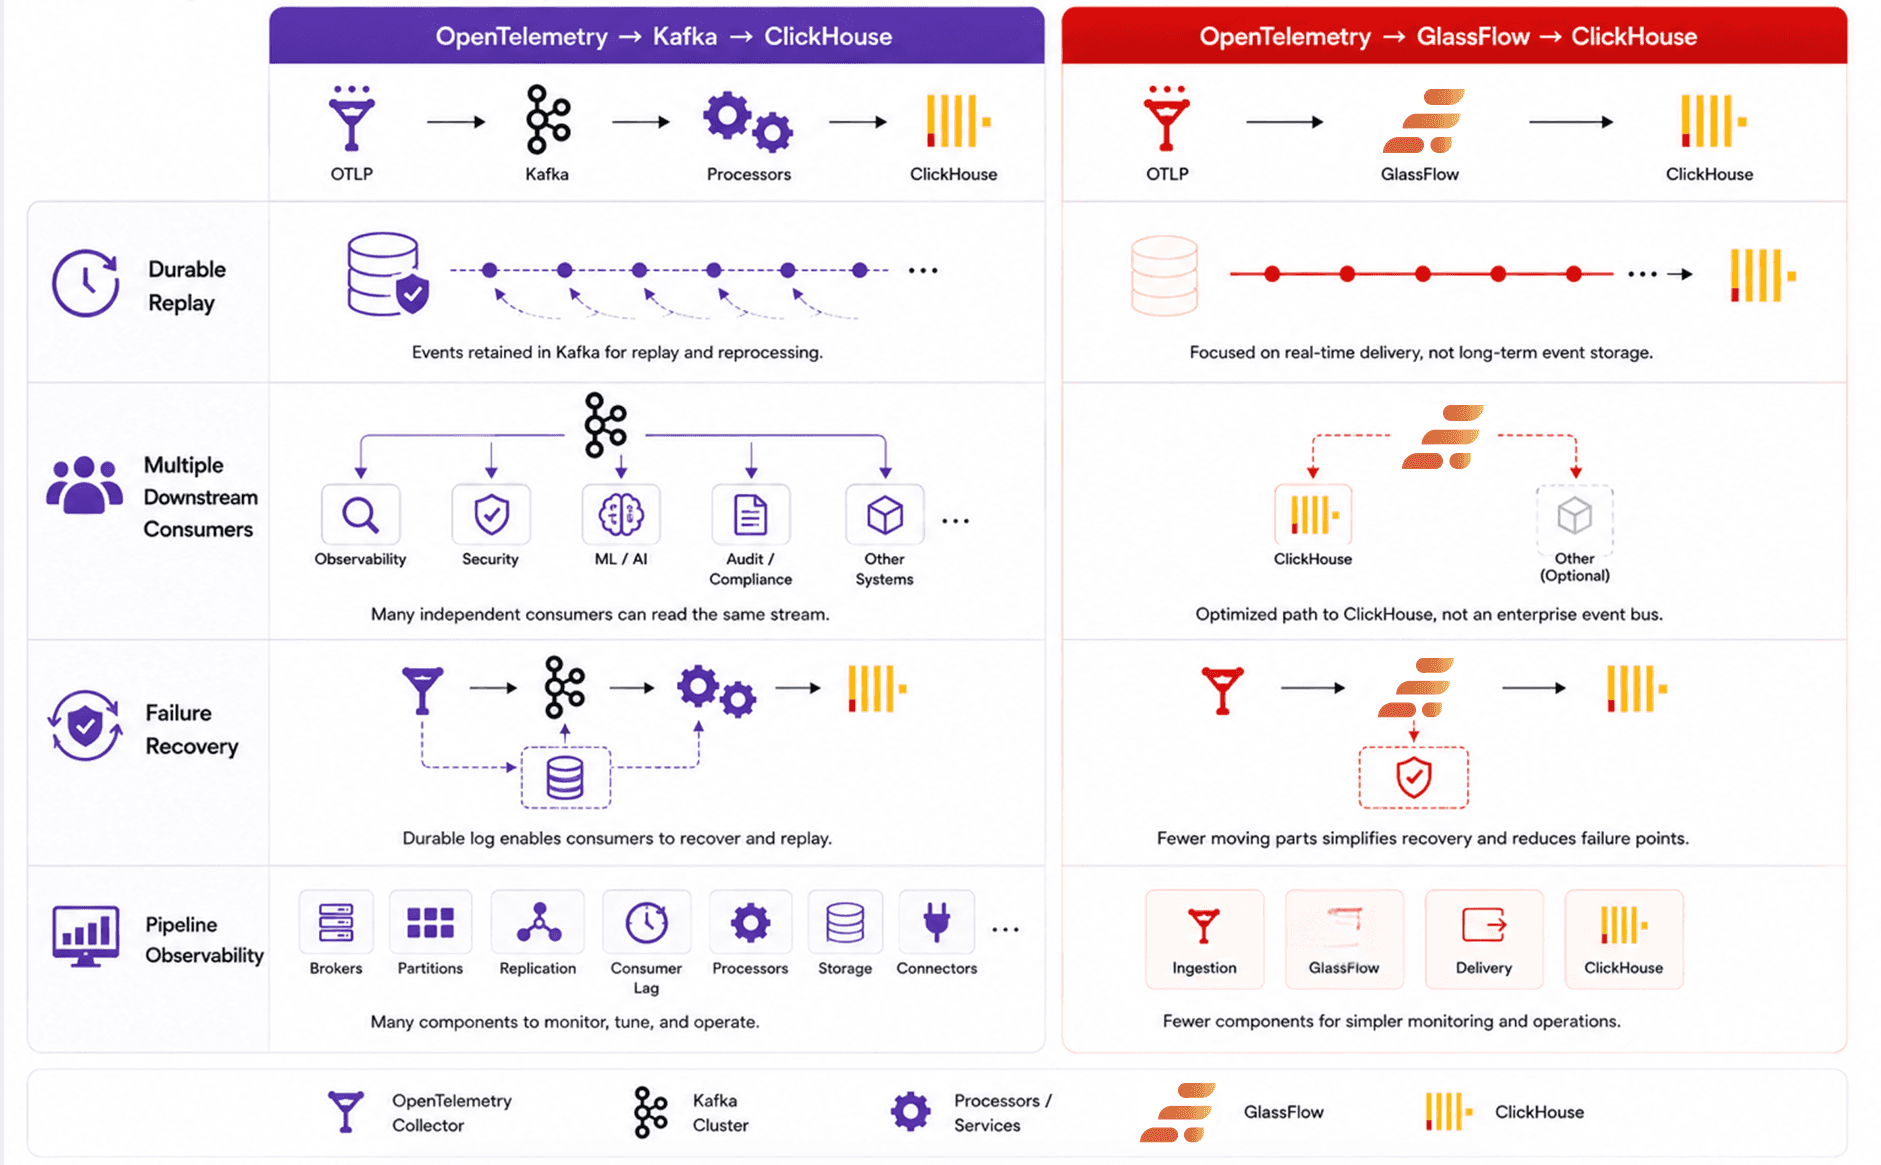
Figure 6. Comparing the two from a Reliability standpoint
Performance and operational simplicity are important, but reliability requirements often determine which architecture is the better fit long term.
Kafka was designed as a durable distributed event streaming platform, while GlassFlow is designed as a focused telemetry ingestion and processing layer for ClickHouse. As a result, the two architectures make different trade-offs around replay, consumer flexibility, and operational scope.
Durable Replay
One of Kafka’s biggest strengths is durable replay. Events remain stored inside Kafka topics for configurable retention periods, allowing teams to reprocess historical telemetry when pipelines fail, schemas change, or downstream systems need recovery. This becomes extremely valuable in large organizations where telemetry may feed multiple analytics systems, machine learning pipelines, archival systems, or compliance workflows over time.
GlassFlow takes a more streamlined approach focused on real-time telemetry delivery into ClickHouse. Instead of acting as a long-term event store, it focuses on reliable ingestion, processing, and delivery for observability workloads.
For teams that require extensive replay capabilities or long-lived event retention, Kafka remains the stronger architectural choice. For teams primarily optimizing real-time observability pipelines, GlassFlow reduces complexity by avoiding an additional durable event streaming layer.
Multiple Downstream Consumers
Kafka excels when many independent systems need access to the same telemetry stream. Different consumers can process logs, traces, and metrics independently for observability, security analytics, ML pipelines, auditing, or real-time applications. This decoupled architecture is one of Kafka’s biggest advantages in large platform engineering environments.
GlassFlow is more focused on the telemetry-to-ClickHouse path itself. Instead of acting as a central enterprise event bus, it focuses on processing telemetry efficiently before storage.
For organizations building broad event streaming ecosystems, Kafka provides significantly more flexibility. For teams primarily concerned with observability ingestion into ClickHouse, GlassFlow offers a more focused and operationally simpler architecture.
Failure Recovery
Kafka’s durability model provides strong recovery guarantees during downstream outages or infrastructure failures. Since events remain persisted inside Kafka, consumers can recover independently and continue processing from previous offsets. This makes Kafka especially attractive for systems where replayability and fault isolation are critical operational requirements.
GlassFlow approaches recovery differently by simplifying the number of infrastructure layers involved in the pipeline. With fewer components, there are fewer independent systems that can fail, coordinate, or drift out of sync. For observability-focused pipelines, this simpler architecture can often improve operational reliability by reducing overall system complexity rather than relying on large durable buffering layers.
Pipeline Observability
Kafka-based architectures often require monitoring across many independent components: brokers, partitions, replication health, consumer lag, storage utilization, processors, and downstream ingestion services. At scale, operating the observability pipeline itself can become a significant observability problem.
GlassFlow reduces this operational surface area by consolidating ingestion and processing into a more focused telemetry pipeline. Fewer infrastructure layers generally result in simpler monitoring, troubleshooting, and operational management.
The trade-off is flexibility. Kafka provides broader ecosystem capabilities, while GlassFlow prioritizes operational simplicity and ClickHouse-focused observability ingestion.
6. Kafka vs GlassFlow for OpenTelemetry to ClickHouse: Decision Guide
At this point, the trade-off becomes less about raw capability and more about architectural priorities.
Kafka is one of the most mature and battle-tested distributed event streaming platforms available today. It excels in environments where telemetry is part of a broader event-driven ecosystem involving many downstream systems, long-term replayability, and organization-wide data streaming.
GlassFlow takes a more focused approach. Instead of acting as a general-purpose event bus, it simplifies the ingestion and processing path between OpenTelemetry and ClickHouse. For many observability-focused teams, this reduces operational complexity while still providing the processing capabilities needed for high-volume telemetry pipelines.
The right choice depends primarily on what role telemetry plays inside your broader platform architecture.
Choose Kafka If
Kafka is usually the better choice when telemetry is only one part of a much larger event streaming ecosystem.
Choose Kafka if you need:
Long-term durable replay of telemetry streams
Many independent downstream consumers
Organization-wide event streaming infrastructure
Cross-region or multi-datacenter event distribution
Complex stream processing pipelines across multiple teams
Very large-scale streaming platforms with shared event infrastructure
Existing Kafka expertise and operational tooling inside the organization
Kafka works especially well in large platform engineering environments where observability, analytics, security, ML pipelines, and business systems all consume the same event streams independently.
The trade-off is operational complexity. Teams must manage brokers, partitions, retention, scaling, storage, upgrades, monitoring, and consumer coordination over time.
Choose GlassFlow If
GlassFlow is usually the better choice when the primary goal is building a reliable and operationally simple observability pipeline into ClickHouse.
Choose GlassFlow if you want:
Direct OTLP ingestion into ClickHouse
Real-time telemetry processing without separate stream processors
Simpler infrastructure and deployment
Lower operational overhead
Built-in enrichment, filtering, deduplication, and batching
Lower end-to-end ingestion latency
A pipeline designed specifically for ClickHouse observability workloads
In practice, GlassFlow is built specifically for teams running OpenTelemetry to ClickHouse without Kafka where the goal is a reliable, lower-overhead observability pipeline rather than a full enterprise streaming platform.
GlassFlow works particularly well for startups, scale ups, and platform teams that do not want to operate Kafka clusters solely to move telemetry into ClickHouse. Instead of building and maintaining a larger event streaming platform, teams can focus directly on observability ingestion and analytics.
Ready to replace Kafka in your observability pipeline?
Set up GlassFlow in minutes →
Kafka vs GlassFlow at a Glance
Category | Kafka Pipeline | GlassFlow Pipeline |
|---|---|---|
Primary Role | General-purpose event streaming | Observability-focused ingestion |
Architecture | Flexible but infrastructure-heavy | Focused and simplified |
Replay Support | Strong long-term replay | Optimized for real-time delivery |
Downstream Consumers | Excellent multi-consumer support | Primarily ClickHouse-focused |
Operational Complexity | Higher | Lower |
Infrastructure Footprint | Larger | Smaller |
Stream Processing | Requires additional frameworks/services | Built-in processing layer |
ClickHouse Optimization | Usually implemented separately | Native pipeline optimization |
Latency | Higher due to additional stages | Lower end-to-end ingestion latency |
Best Fit | Large streaming ecosystems | Observability pipelines into ClickHouse |
Why Not Send OTLP Directly to ClickHouse?
OTLP ClickHouse ingestion via community exporters is possible, and for simple setups it can work but raw OTLP data is rarely ClickHouse-ready, and the gaps surface quickly in production. But raw OTLP data is rarely ClickHouse-ready, and the gaps tend to surface quickly in production:
Schema mismatch. OTLP's nested, attribute-heavy model is designed for portability, not analytics. Without flattening and normalization, you end up with JSON blobs that defeat the purpose of using ClickHouse.
Insert inefficiency. The Collector is not designed to buffer and batch inserts the way ClickHouse requires. Too many small inserts cause merge pressure and degrade query performance over time.
No filtering before storage. Health checks, debug noise, and duplicate spans all land in ClickHouse. Storage costs grow faster than signal value.
No deduplication. At-least-once delivery means duplicates accumulate silently and distort queries.
A processing layer exists precisely to close the gap between how telemetry is collected and how ClickHouse needs to receive it.
Summary
There is no universal winner between Kafka and GlassFlow because the architectures solve slightly different problems.
Kafka is the stronger choice when telemetry needs to participate in a broader enterprise streaming platform with many downstream consumers and durable replay requirements while GlassFlow is the stronger choice when the primary objective is building a high-throughput, lower-latency, operationally simpler OpenTelemetry-to-ClickHouse pipeline.
For teams specifically looking for a Kafka alternative for observability, GlassFlow is designed for exactly that trade-off: the processing capabilities you need, without the operational footprint of a distributed streaming platform.
Conclusion
OpenTelemetry and ClickHouse are a powerful foundation for modern observability platforms. The real architectural decision is how much infrastructure should exist between telemetry collection and analytics storage.
Kafka remains an excellent choice for large-scale event streaming ecosystems that require durable replay, multiple downstream consumers, and long-term event retention. But many observability pipelines do not need the operational overhead of a full distributed streaming platform.
For teams building a ClickHouse observability pipeline, GlassFlow simplifies the ingestion and processing path by removing the need for a separate streaming layer between collection and storage. For teams primarily building observability pipelines, this can reduce infrastructure complexity, operational overhead, and maintenance effort while still supporting high-throughput telemetry workloads.
The right architecture ultimately depends on whether your priority is building a broad streaming platform or a simpler, ClickHouse-focused observability pipeline.
If you're evaluating this for your stack, book a proof of concept session and we'll help you assess the right architecture for your workload.
References and Further Reading
Direct OpenTelemetry → GlassFlow → ClickHouse Pipeline
Building a ClickHouse Telemetry Pipeline with OpenTelemetry and GlassFlow A hands-on tutorial showing how to ingest OpenTelemetry telemetry directly into GlassFlow and deliver processed data into ClickHouse without Kafka.
Kafka → GlassFlow → ClickHouse Architecture
Open Source Observability with ClickStack and GlassFlow Explores an architecture where GlassFlow sits between Kafka and ClickHouse as a real-time transformation and processing layer for observability pipelines.
Additional GlassFlow Resources
Did you like this article? Share it!
You might also like

Data transformations at TB scale for ClickHouse
Get query ready data, lower ClickHouse load, and reliable pipelines at enterprise scale.
