ljn
Observability
Open source observability with ClickStack and GlassFlow
Written by
Armend Avdijaj
-

— Updated: June 2026 —
Introduction
Engineers building modern data systems are frequently caught between the high costs of managed observability vendors and the operational complexity of building their own solutions. Common challenges include managing data silos, ensuring data quality from disparate sources, and preventing runaway query costs. The ideal architecture must balance performance, cost, and maintainability.
Since its launch, ClickStack has gained significant traction as a cost-effective alternative to managed observability platforms like Datadog and New Relic, particularly for teams already running ClickHouse.
Observability in data pipelines currently involves several operations such as log handling, metrics, traces, and session data at scale. ClickStack, ClickHouse's open-source observability solution, represents this evolution by unifying all observability data as 'wide events' in a single high-performance platform. Meanwhile, GlassFlow addresses a critical gap in real-time ETL processing, providing the essential transformation layer between streaming data sources like Kafka and analytical databases like ClickHouse. This article provides a technical guide on how these technologies work together to create a robust, cost-effective observability architecture that solves traditional challenges of data deduplication, schema evolution, and real-time processing at scale.
Understanding ClickStack as a Complete Observability Platform
Traditional observability stacks often require engineering teams to assemble and manage disparate tools for logs, metrics, and traces. ClickStack provides a complete, opinionated full-stack experience that eliminates this complexity. It combines the ClickHouse database engine, the HyperDX UI, a purpose-built OpenTelemetry collector, and pre-optimized schemas into a single, cohesive unit. This approach embodies an "Observability 2.0" philosophy by breaking away from siloed data. Instead, it stores context-rich "wide events" that unify telemetry, removing the need to manually correlate data during incident response.
To understand the cost implications of this, consider how ClickStack compares to traditional observability solutions:
Traditional Observability Stack | ClickStack Unified Approach |
|---|---|
Separate tools for logs, metrics, traces | Single platform for all telemetry types |
Manual correlation during incidents | Pre-correlated wide events |
Multiple vendor bills | Single open-source solution |
Complex data pipeline management | Opinionated, batteries-included setup |
Limited cross-signal analysis | Native joins across all data types |
Typical cost: $50-200/GB/month | Typical cost: $5-20/GB/month |
The technical architecture is composed of four primary components. At its core is the ClickHouse Database Engine, providing real-time analytical performance and native support for dynamic JSON structures. The user interface is HyperDX UI, a React-based application offering Lucene-style search, session replay, and direct SQL access for deep analysis. Ingestion is managed by a custom distribution of the OpenTelemetry Collector, which serves as the standard gateway for all telemetry data. Finally, a MongoDB State Store handles application-level management for dashboards, user configurations, and alerts, separating application state from event data for better scalability.
Below is a high-level architectural diagram of the process:
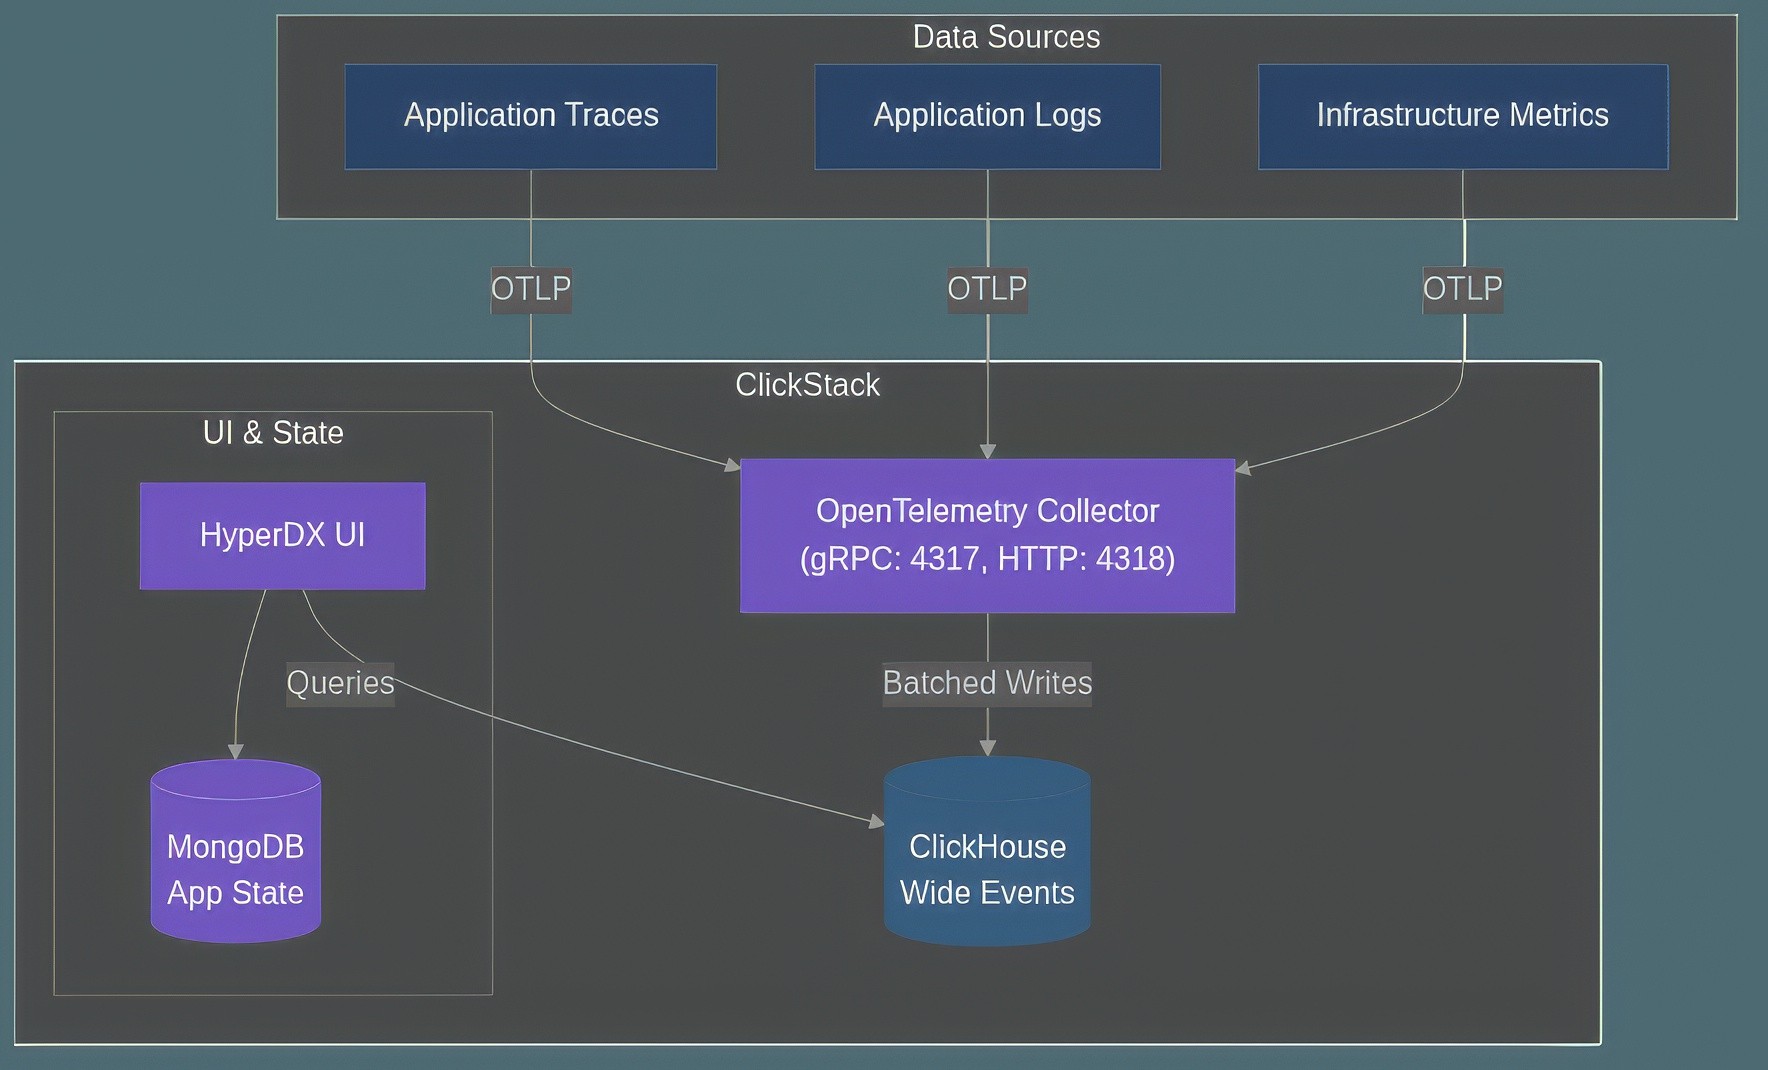
Figure 1: The technical architecture of ClickStack, showing the flow of telemetry data from sources through the OpenTelemetry Collector into ClickHouse, with HyperDX as the user interface.
The primary ingestion path into ClickStack is the OpenTelemetry Protocol (OTLP), supported over gRPC (port 4317) and HTTP (port 4318). While alternative methods like direct writes via the ClickHouse HTTP API or agents like Vector exist, OTLP provides a standardized approach. The stack is engineered for extreme performance, with ClickHouse enabling sub-second query latency and data processing speeds of 2-10 GB/s.
This component-based architecture provides several key advantages:
Separation of Concerns: Event data (ClickHouse) is kept separate from application metadata (MongoDB), simplifying backups and scaling.
Open Standards: The use of an OpenTelemetry Collector prevents vendor lock-in at the ingestion layer.
Optimized UI: The HyperDX UI is purpose-built for the "wide event" model, unlike general-purpose BI tools.
GlassFlow's Real-Time ETL Capabilities
GlassFlow is an open-source stream processor engineered to solve the common data quality challenges in Kafka-to-ClickHouse pipelines. It acts as a transformation layer, addressing complexities like real-time deduplication and enrichment that are difficult to manage with ingestion tools alone. Available as a self-hosted solution or a forthcoming serverless cloud offering, GlassFlow uses NATS as a low-latency messaging backbone for its internal processing, enabling transformations with single-digit millisecond latency. The system provides exactly-once processing semantics and uses a lightweight in-memory state store to manage the context required for time-windowed operations.
Below are some of the features and how they benefit observability pipelines:
GlassFlow Feature | Benefit for Observability Pipelines |
|---|---|
Real-time Deduplication | Prevents duplicate logs/traces, ensuring accurate alert counts. |
Temporal Stream Joins | Enriches events with context (e.g., user metadata) pre-ingestion. |
Exactly-Once Semantics | Guarantees data integrity for critical metrics. |
Schema Evolution Handling | Avoids pipeline failures when new telemetry fields are introduced. |
Its native Kafka connector simplifies setup and automatically scales processing workers based on topic partitions. It primarily handles JSON data and allows for performance optimization through configurable batch sizes for the ClickHouse sink. GlassFlow's key value lies in its advanced transformation features. It performs real-time deduplication based on a user-defined key within a configurable time window of up to seven days, ensuring duplicate events are rejected before they reach ClickHouse. It also supports temporal joins between two Kafka streams, which is ideal for enriching event data with contextual information from a separate stream. The platform is designed to handle schema evolution automatically, simplifying operations when the structure of source data changes over time.
Solving Observability Data Challenges: GlassFlow + ClickStack
The combination of GlassFlow and ClickStack directly addresses several persistent problems in managing observability data at scale. A primary challenge is data deduplication. ClickHouse's ReplacingMergeTree engine handles duplicates eventually during background merges, which means queries executed immediately after ingestion may return inaccurate counts. Forcing guaranteed deduplication with the FINAL modifier is possible but severely degrades query performance. GlassFlow solves this problem by performing stateful deduplication upstream; it maintains a record of recently seen event IDs and discards duplicates before they are ever written to ClickHouse, ensuring the data at rest is always clean and accurate.
Some of the common challenges and solutions that GlassFlow + ClickHouse bring to the table include:
Challenge | ClickHouse Native Limitation | GlassFlow + ClickStack Solution |
|---|---|---|
Data Deduplication |
| Upstream, stateful deduplication ensures clean data upon ingestion. |
Schema Evolution | Requires manual | Automated schema detection and column creation in the sink. |
Real-time Data Enrichment | Query-time | Pre-ingestion temporal joins create flat, fast-to-query tables. |
Data Quality | Inconsistent or invalid data can pollute the database. | Upstream filtering and transformation act as a quality gate. |
For a deeper comparison of OpenTelemetry pipeline architectures, see: Do you actually need Kafka between OpenTelemetry and ClickHouse?
Another significant challenge is schema evolution. Observability data schemas are dynamic, with new fields and structures appearing as applications are updated. While ClickHouse supports schema changes, managing this in a high-volume streaming pipeline is complex. GlassFlow's ClickHouse sink can be configured to manage the schema automatically, detecting new fields in source JSON and issuing ADD COLUMN statements to the target table as needed. This prevents data loss from schema mismatches and removes a significant operational burden.
Finally, the architecture enforces data quality and consistency. Observability data is often plagued by high cardinality dimensions, clock skew, and inconsistent log formats. GlassFlow acts as a quality gate where data can be validated, filtered, and normalized during the transformation stage. Events that fail validation can be routed to a dead-letter queue for later analysis, ensuring that only clean, structured data lands in ClickStack.
Architecture Patterns and Best Practices
The recommended architecture for a robust and scalable pipeline follows a three-layer design: Kafka for durable data buffering, GlassFlow for real-time transformation, and ClickStack for high-performance analytics and storage. This model decouples ingestion, processing, and storage, allowing each layer to be scaled and managed independently. For optimal ClickHouse performance, data should be inserted in large, asynchronous batches, a pattern that GlassFlow's sink connector is designed to facilitate.
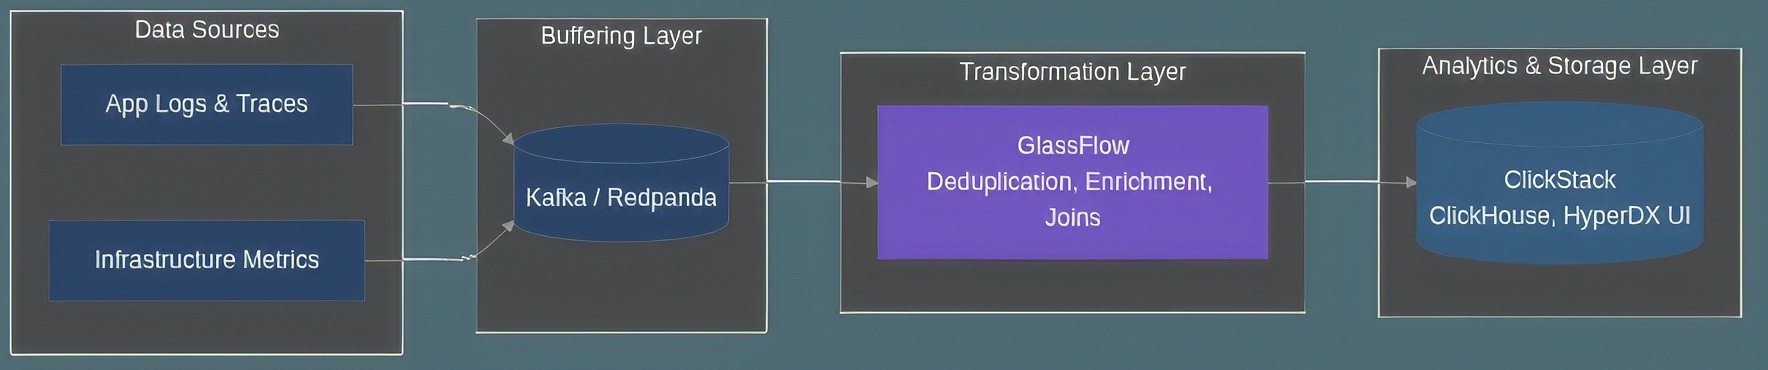
Figure 2: Recommended three-layer pipeline architecture using Kafka, GlassFlow, and ClickStack for a scalable and resilient observability platform.
For production deployments, both GlassFlow and ClickStack can be deployed using Docker Compose for local development or orchestrated in cloud environments with Kubernetes. A critical aspect of production operations is end-to-end monitoring, which should track Kafka consumer lag, GlassFlow processing latency, and ClickHouse query performance. This architecture is designed for linear scalability. As data volumes increase, resources can be added to each layer independently. By cleaning and deduplicating data upstream, GlassFlow significantly reduces the computational load on ClickHouse, minimizing the need for expensive FINAL queries, lowering storage costs, and improving overall system efficiency.
Real-World Implementation Examples
The principles behind this architecture are proven in massive production environments. Companies like Cloudflare have famously used ClickHouse to analyze millions of messages per second for their HTTP analytics, demonstrating the database's capacity for extreme-scale observability workloads. The pattern of using a transformation layer to ensure data quality before ingestion is a well-established best practice in such systems.
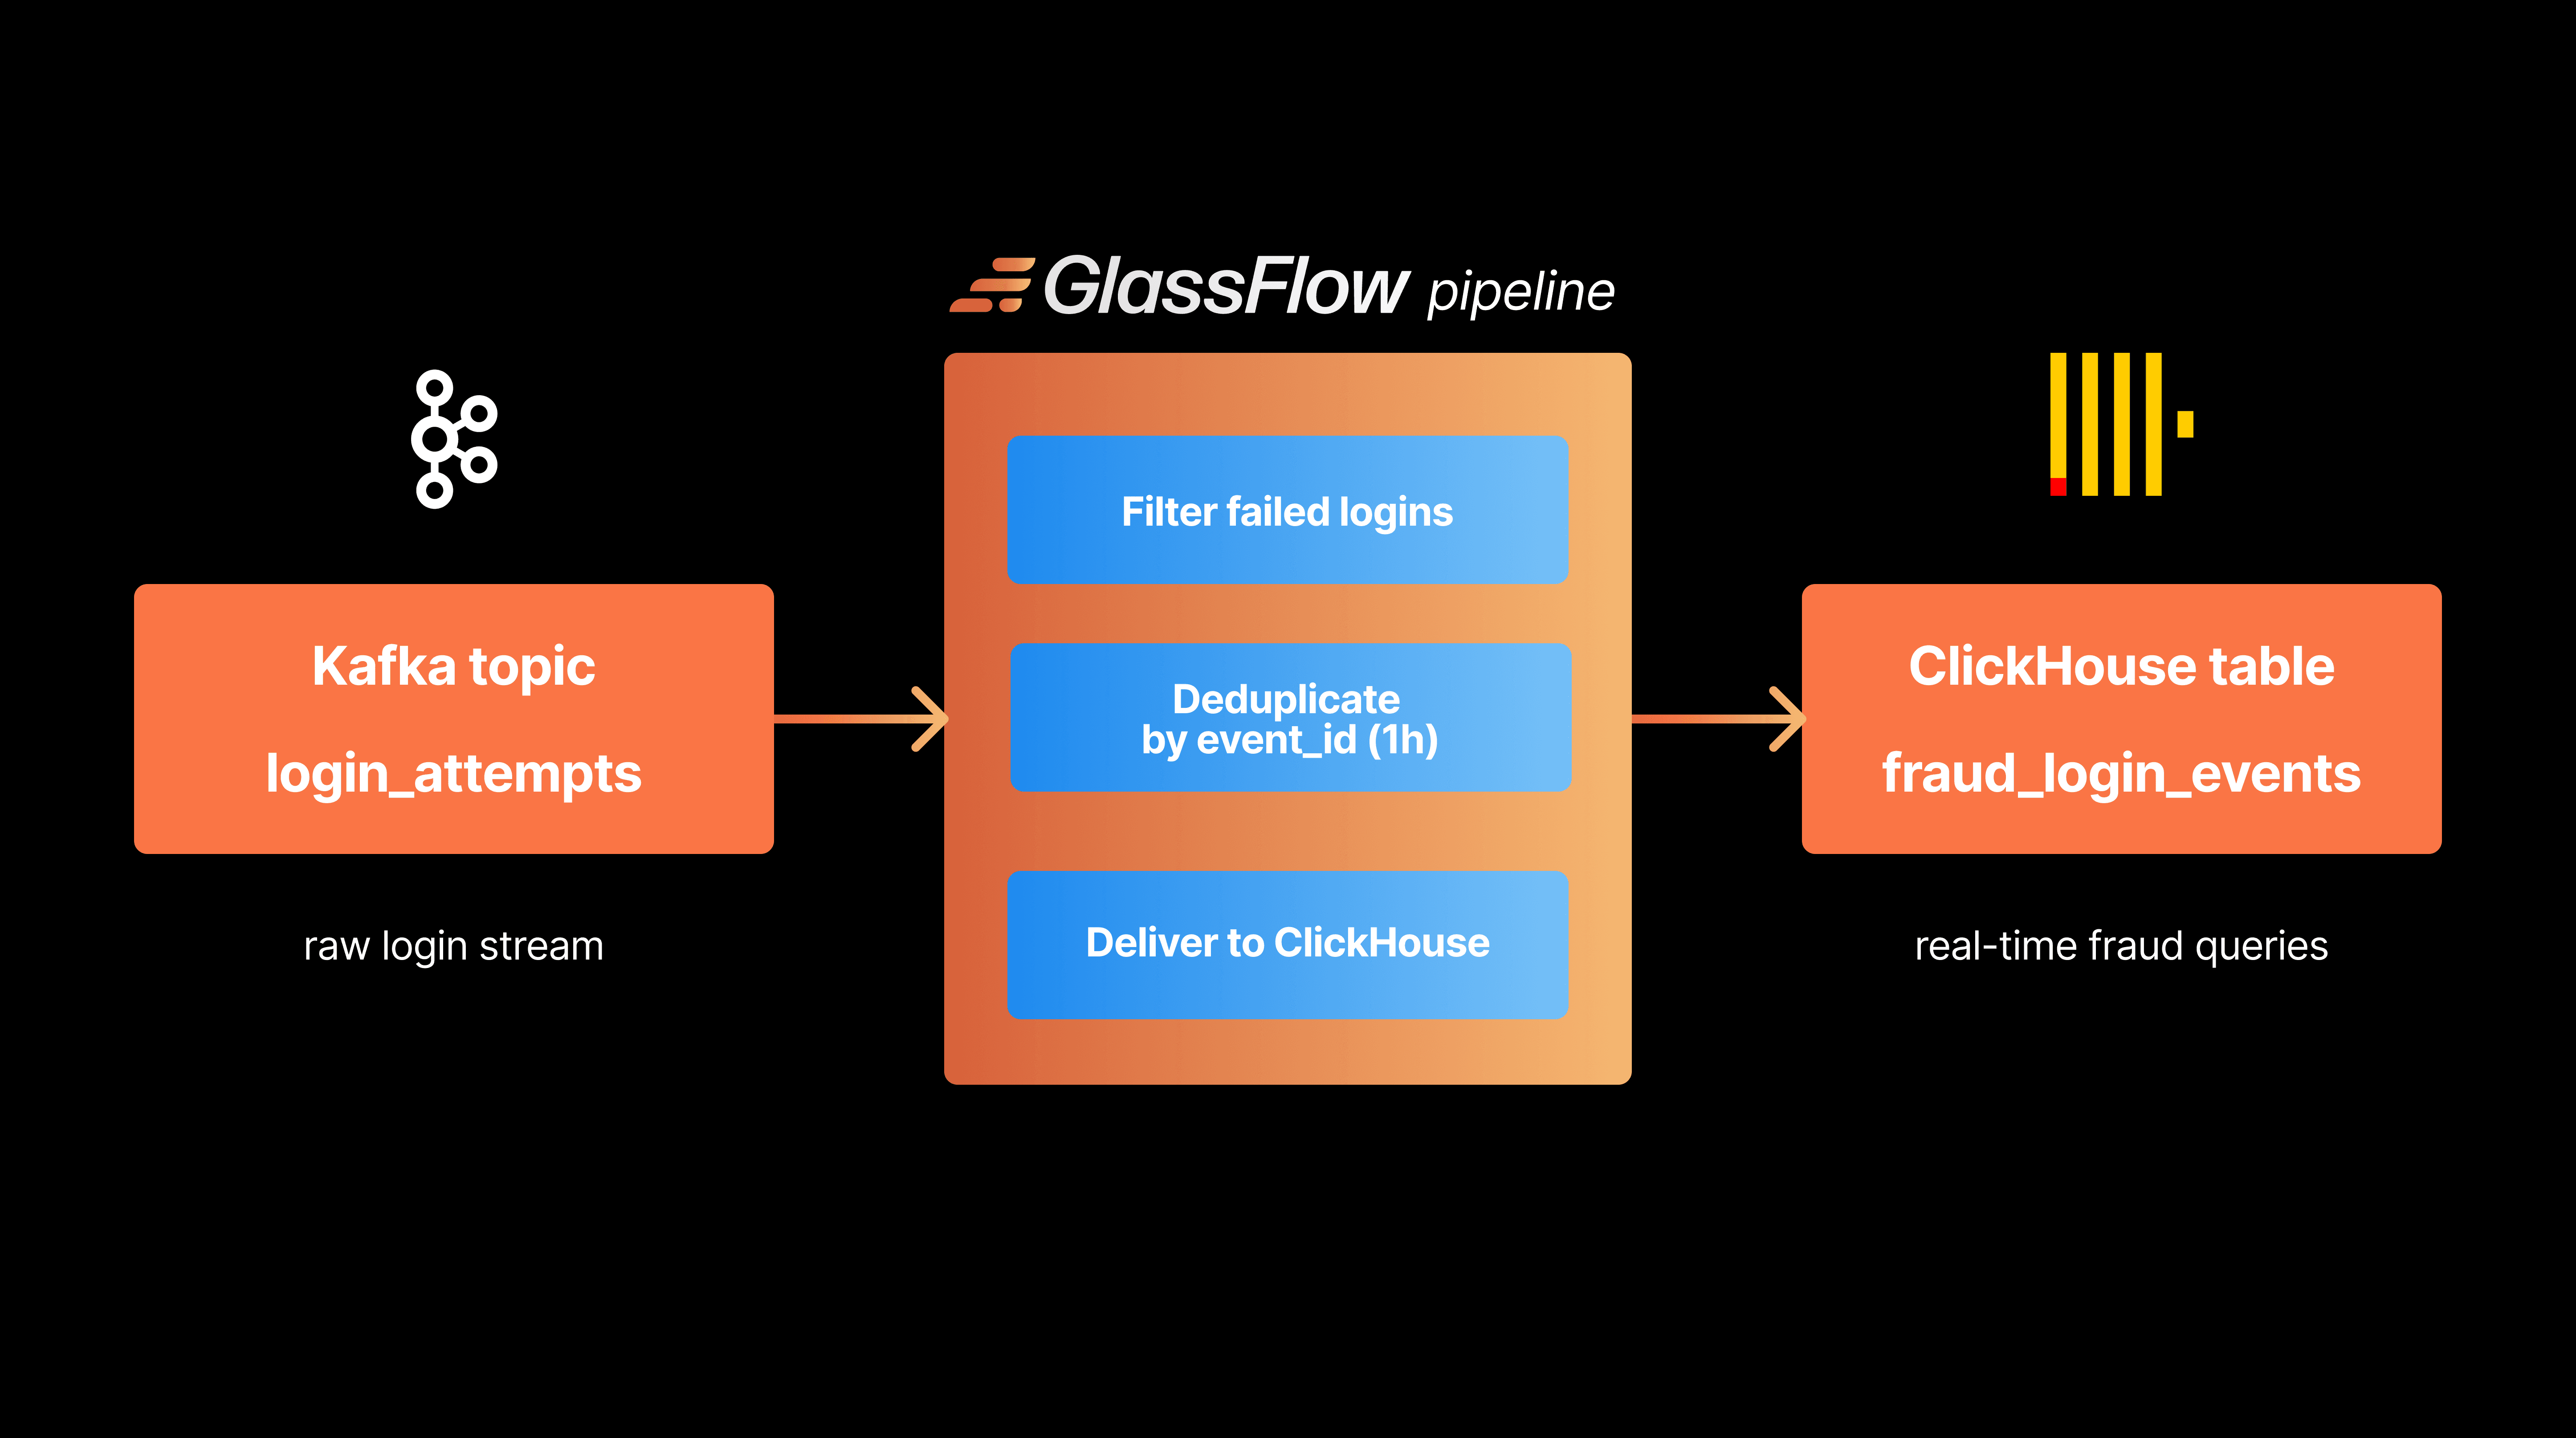
A GlassFlow pipeline is typically defined using a declarative JSON configuration. The following conceptual example illustrates a pipeline that reads logs from Kafka, deduplicates them by trace_id, and writes them to a ClickStack logs table.
Codeblock 1: A conceptual GlassFlow configuration for reading OTLP logs from Kafka, deduplicating them by trace_id over a 24-hour window, and sinking them into a ClickStack logs table.
On the ClickStack side, table schema design is critical for performance. A common and effective pattern for observability data is a wide table with time-based partitioning and an ordering key that aligns with common query patterns.
Codeblock 2: A sample ClickHouse table schema for storing OTLP traces, optimized with partitioning and an effective ordering key for fast queries.
Implementation Guide and Migration Strategy
Getting started with this stack can be streamlined by using the Docker Compose files provided by both projects for local development. A combined configuration allows for end-to-end testing of a pipeline running Kafka, GlassFlow, and ClickStack. The initial pipeline can be configured using the GlassFlow web UI, and its behavior validated by sending test data and querying ClickHouse directly.
When migrating from an existing observability system, a gradual approach is recommended. The new GlassFlow and ClickStack pipeline should run in parallel with the current system. A "dual-write" strategy, where telemetry is sent to both platforms simultaneously, allows for thorough validation of data consistency and performance without impacting production users. Once the new stack is proven to be reliable and performant, a production cutover can be scheduled by redirecting dashboards and alerts to ClickStack.
Before a full production cutover, ensure the following criteria are met:
Monitoring and Alerting:
Consumer lag on Kafka topics is monitored and alerted on.
End-to-end pipeline latency (from source to queryable in ClickStack) is measured.
Resource utilization (CPU, memory, disk) for all components is tracked.
Security:
All data in transit is encrypted (TLS for Kafka, ClickHouse, etc.).
Access controls and authentication are configured for all services.
Network policies restrict communication to only necessary components.
Disaster Recovery:
A backup and restore strategy for ClickHouse data and MongoDB state is tested.
Failover procedures for stateless components (GlassFlow, OTel Collector) are validated.
Data retention policies are configured and verified.
Performance Validation:
The pipeline has been load-tested with traffic volumes exceeding production peaks.
Query performance on ClickStack meets defined SLOs under load.
Autoscaling mechanisms (if used) have been tested and proven effective.
Final Thoughts
The combination of ClickStack and GlassFlow represents a significant advancement in open-source observability architecture. ClickStack's unified data model eliminates traditional data silos while providing cost-effective, high-performance storage and querying. GlassFlow's real-time ETL processing solves the critical and often painful challenges of data quality, deduplication, and schema evolution that have historically plagued streaming observability pipelines.
This architecture enables organizations to build robust, scalable observability platforms capable of handling modern application complexity while maintaining operational simplicity and cost efficiency. By offloading complex stream processing from the analytical database to a specialized ETL layer, you ensure your observability platform is built on a foundation of clean, reliable data. The path forward from slow, complex, and unreliable ingestion is clear.
Ready to build your ClickStack observability pipeline without the data quality headaches? Try GlassFlow open source on GitHub → or book a proof of concept session to see it running with your data.
References
Real-Time Observability with ClickHouse, Coroot, and GlassFlow
Kafka to ClickHouse® Made Simple with GlassFlow and Altinity.Cloud
ClickStack: A High-Performance OSS Observability Stack on ClickHouse
GlassFlow Load Test: Real-Time Deduplication from Kafka to ClickHouse at Scale
Show HN: ClickStack – open-source Datadog alternative by ClickHouse and HyperDX | Hacker News
Did you like this article? Share it!
You might also like


Data transformations at TB scale for ClickHouse
Get query ready data, lower ClickHouse load, and reliable pipelines at enterprise scale.
