Load Test GlassFlow for ClickHouse: Real-Time Deduplication at Scale
By Ashish Bagri, Co-founder & CTO of GlassFlow
TL;DR
- We tested GlassFlow on a real-world deduplication pipeline with Kafka and ClickHouse.
- It handled 55,00 records/sec published by Kafka and processed 9,000+ records/sec on a MacBook Pro, with sub-0.12ms latency.
- No crashes, no message loss, no disordering. Even with 20M records and 12 concurrent publishers, it remained robust.
- Want to try it yourself? The full test setup is open source: https://github.com/glassflow/clickhouse-etl-loadtest and the docs https://docs.glassflow.dev/load-test/setup
Why this test?
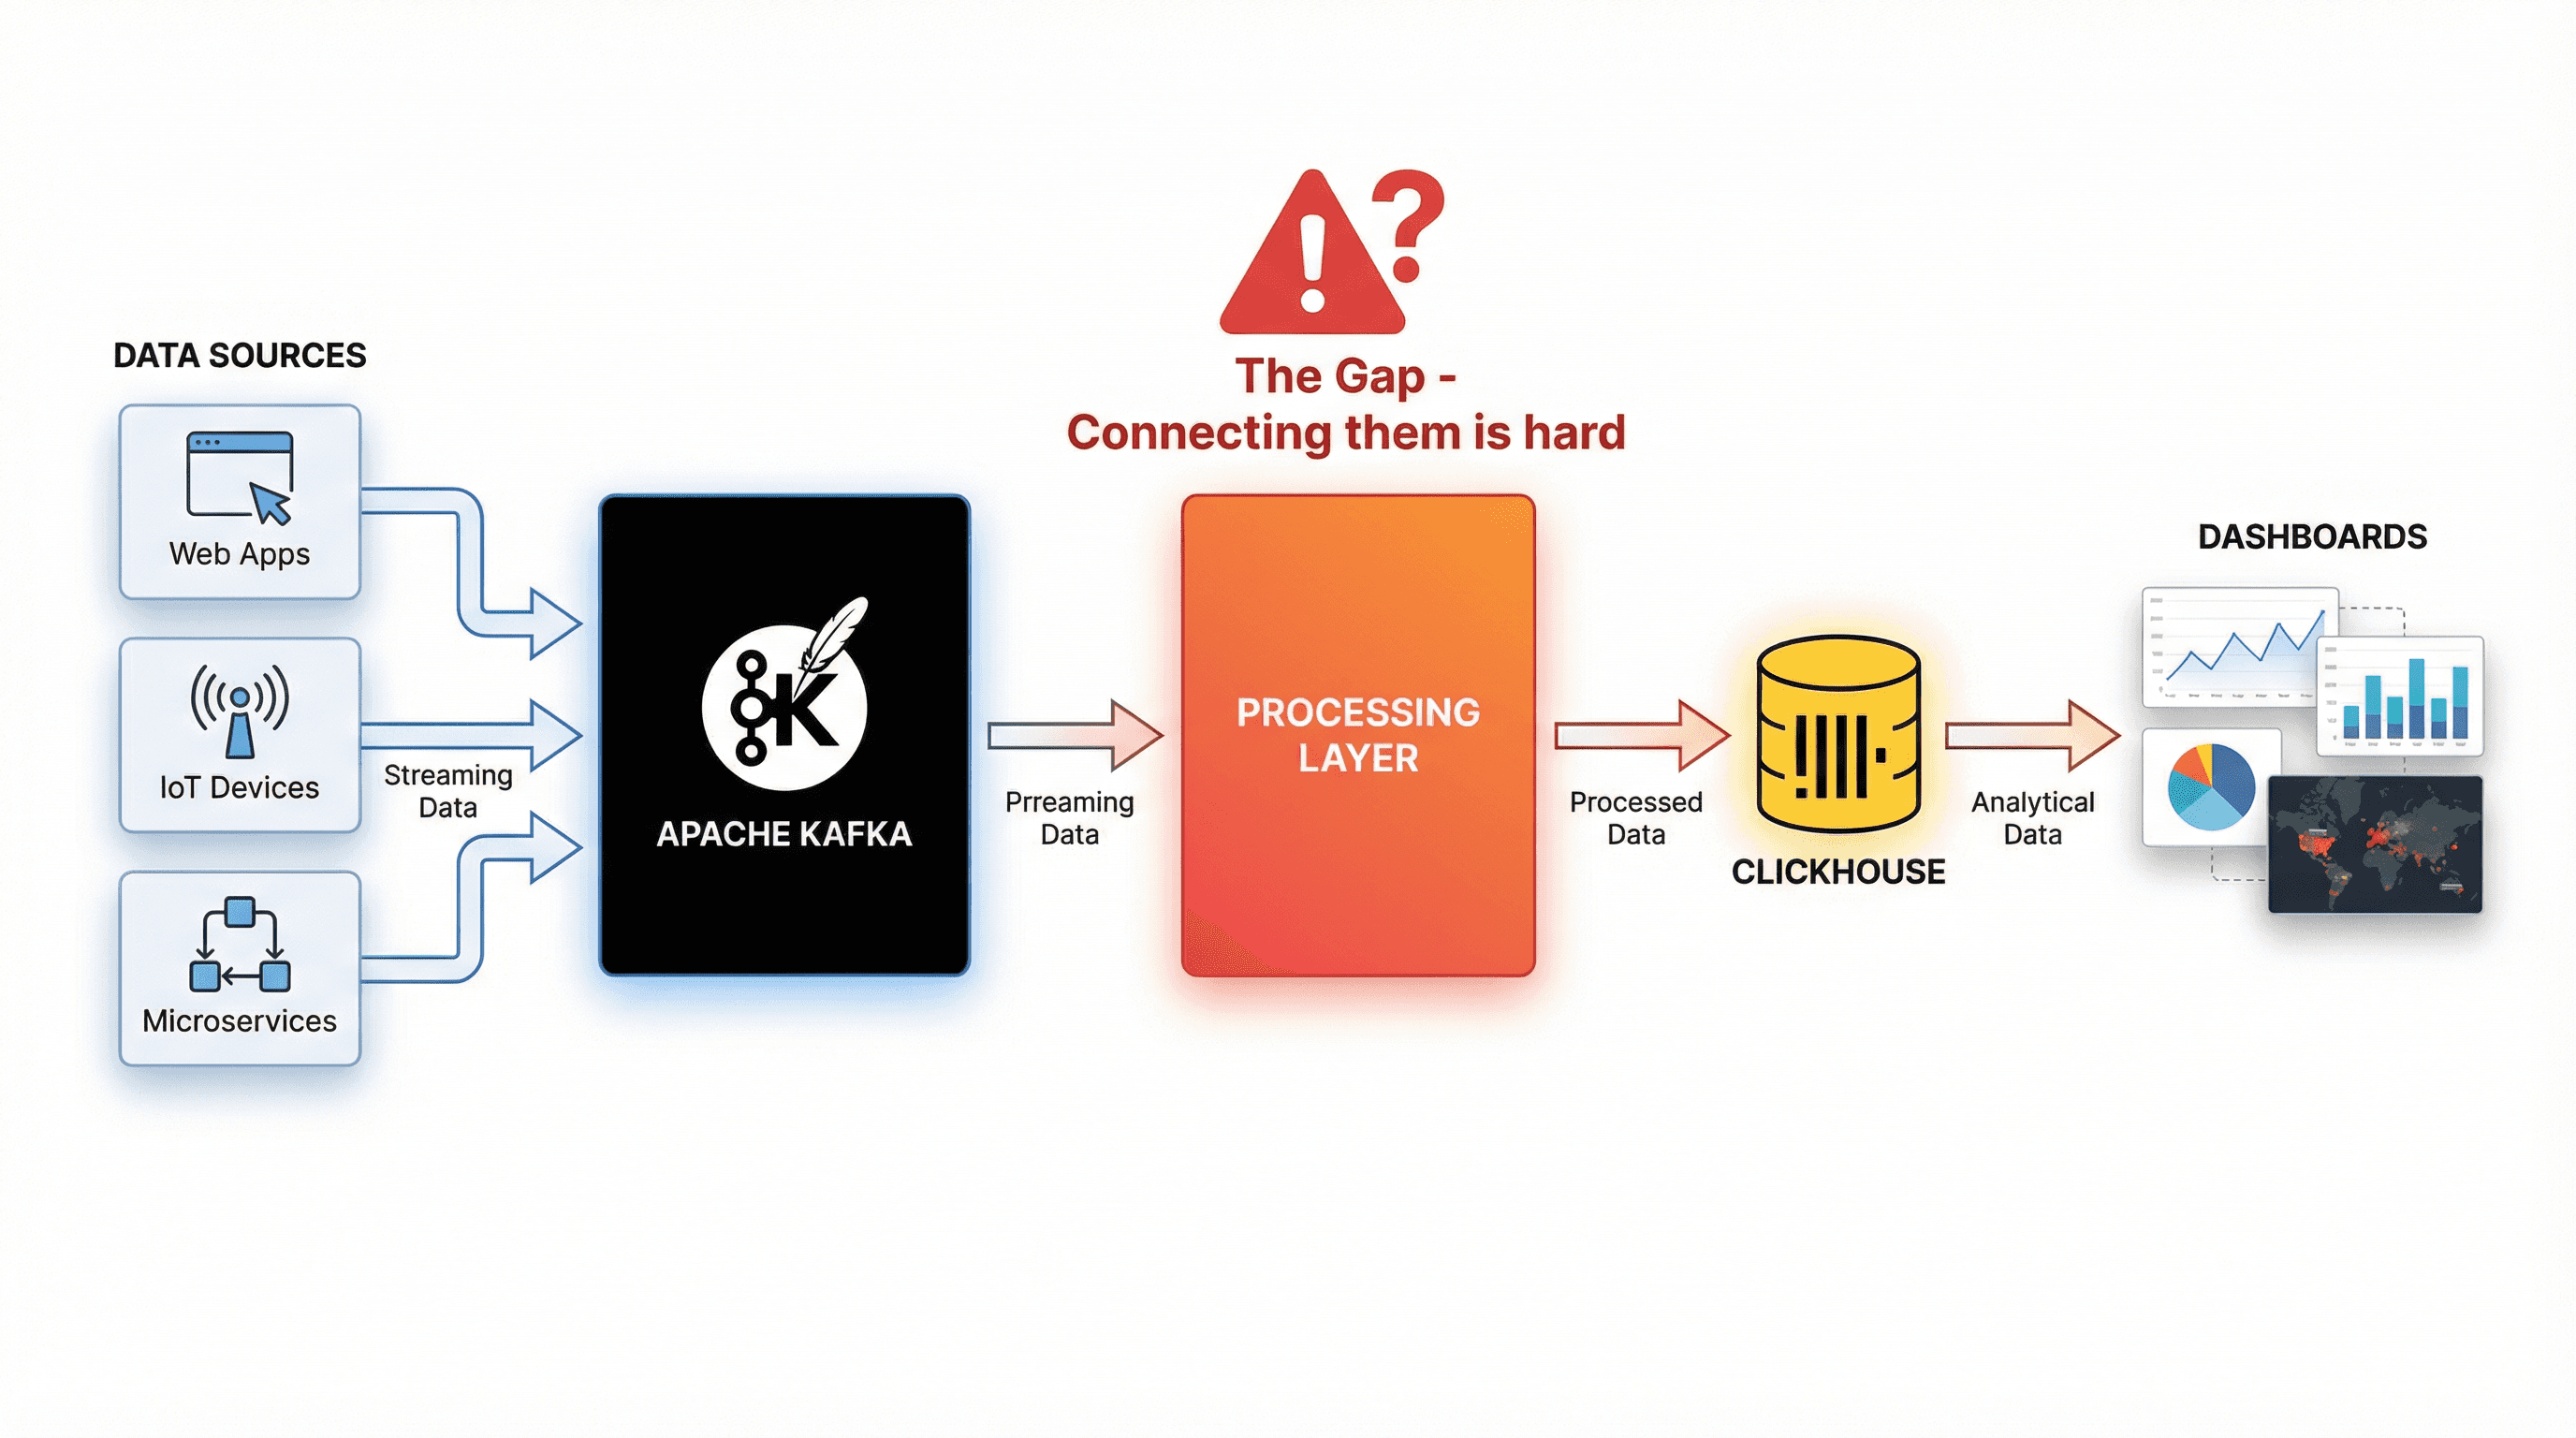
ClickHouse is incredible at fast analytics. But when building real-time pipelines from Kafka to ClickHouse, many teams run into the same issues: analytics results are incorrect or too delayed to support real-time use cases.
The root cause? Data duplications and slow joins. They are often introduced by retries, offset reprocessing, or downstream enrichment. These problems can affect both correctness and performance.
That’s why we built GlassFlow: A real-time streaming ETL engine designed to process Kafka streams before data hits ClickHouse.
After launching the product, we often received the question, “How does it perform at high loads?”
With this post, we want to give a clear and reproducible answer to that. This article walks through what we tested, how we set it up, and what we found when testing deduplications with GlassFlow.
What is GlassFlow?
GlassFlow is an open-source streaming ETL service developed specifically for ClickHouse. It is a real-time stream processing solution designed to simplify data pipeline creation and management between Kafka and ClickHouse. It supports:
- Real-time deduplication (configurable window, event ID based)
- Stream joins between topics
- Exactly-once semantics
- Native ClickHouse sink with efficient batching and buffering
GlassFlow handles the hard parts: state, ordering, retries and batching.
More about GlassFlow at our prev HN post https://news.ycombinator.com/item?id=43953722
Test Assumptions
Before we dive in, here’s what you should know about how we ran the test.
Data Used: Simulating a Real-World Use Case
For this benchmark, we use synthetic data that simulates a real-world use case: logging user events in an application.
Each record represents an event triggered by a user, similar to what you'd see in analytics or activity tracking systems.
Here's the schema:
Field | Type | Description |
---|---|---|
event_id | UUID (v4) | Unique ID for the event |
user_id | UUID (v4) | Unique ID for the user |
name | String | Full name of the user |
email | String | User’s email address |
created_at | Datetime (%Y-%m-%d %H:%M:%S ) | Timestamp of when the event occurred |
This structure helps simulate insert-heavy workloads and time-based queries—perfect for testing how GlassFlow performs with ClickHouse in a realistic, high-volume setting.
Infrastructure Setup
For this benchmark, we will be running the load test locally using Docker to simulate the entire data pipeline. The setup included:
- Kafka: Running in a Docker container to handle event streaming.
- ClickHouse: Also containerized, serving as the storage layer.
- GlassFlow ETL: Deployed in Docker, responsible for processing messages from Kafka and writing them to ClickHouse.
While the setup supports running against cloud-hosted Kafka and ClickHouse, we chose to keep everything local to maintain control over the environment and ensure consistent test conditions.
Each test run automatically creates the necessary Kafka topics and ClickHouse tables before starting, and cleans them up afterward. This keeps the environment clean between runs and ensures reproducible results.
Resource Used for Testing
The load tests were conducted on a MacBook Pro with the following specifications:
Specification | Details |
---|---|
Model Name | MacBook Pro |
Model Identifier | Mac14,5 |
Model Number | MPHG3D/A |
Chip | Apple M2 Max |
Total Number of Cores | 12 (8 performance and 4 efficiency) |
Memory | 32 GB |
Additional Assumptions
Furthermore, to push our implementation to the limits, we do the following:
- We use an example where we have incoming data with some amount of duplication (10%, to be exact) and we need to deduplicate it.
- We perform incremental tests with growing data volume at each step (starting from 5 million records moving our way up to 20 million records).
- Apart from this, we also change several parameters and see how that impacts our overall performance.
So, let’s start with the actual test.
Running the Actual Load Test
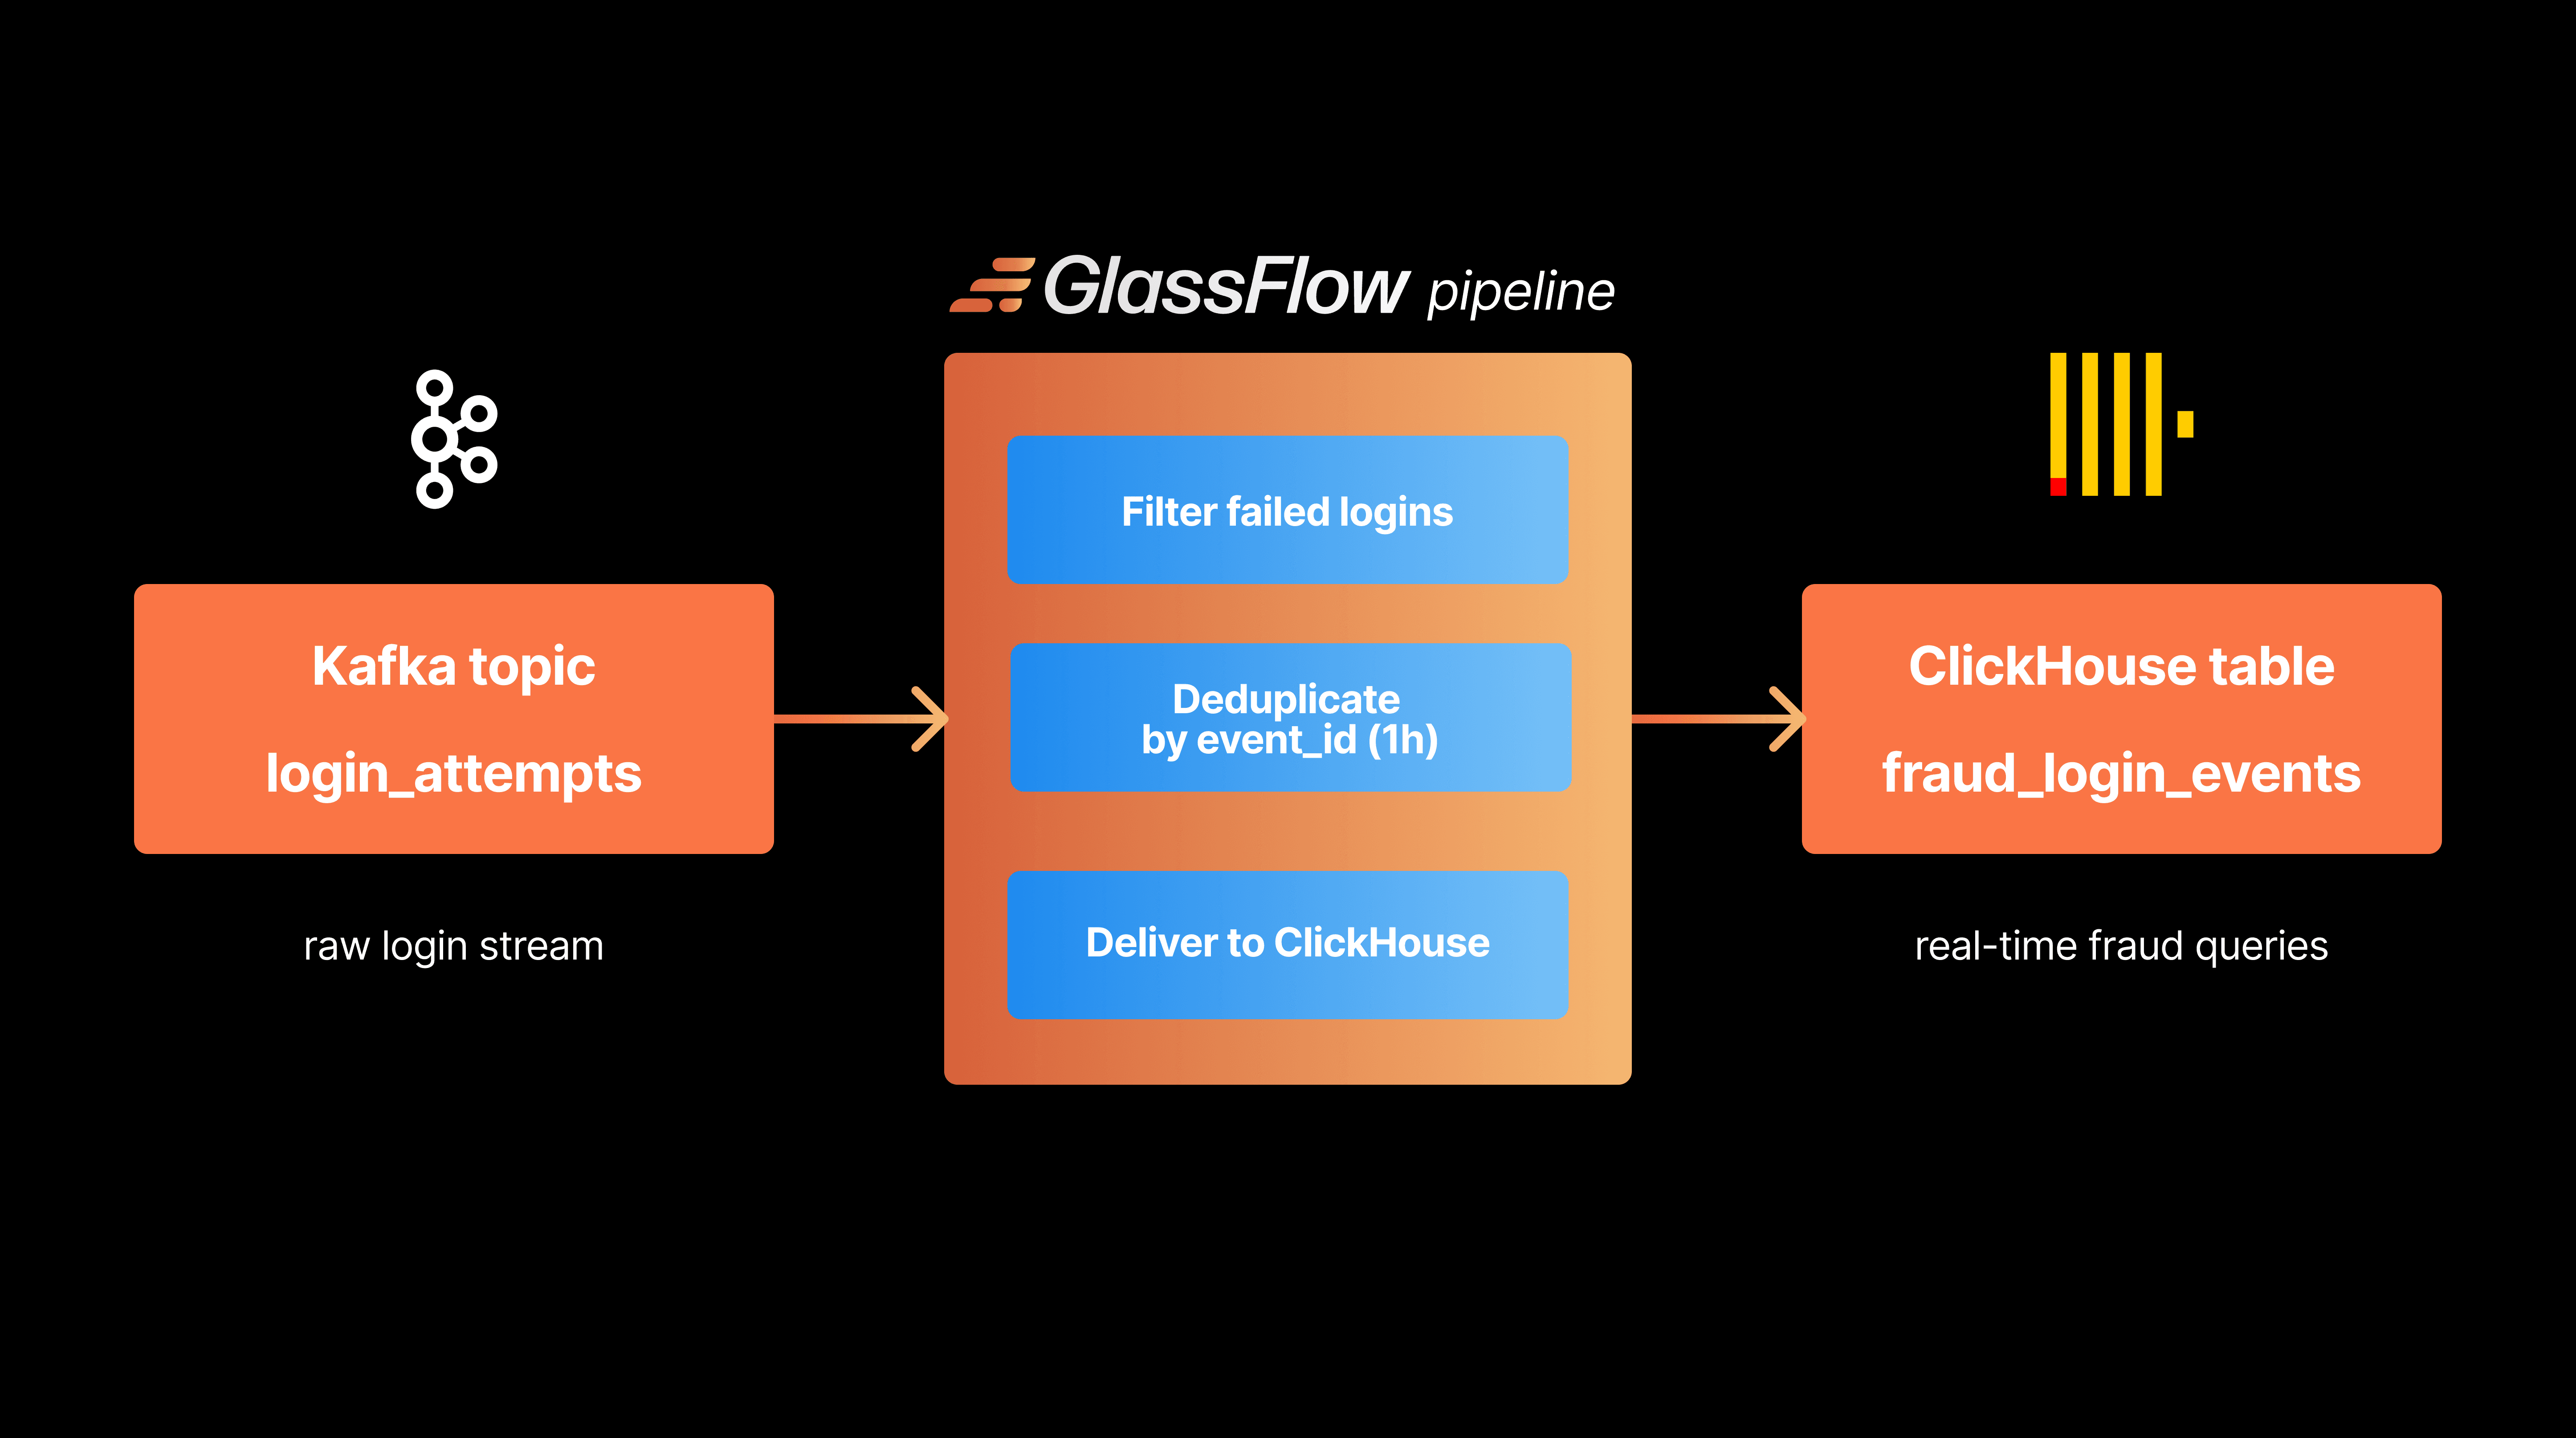
We created a load test repo so you can run this benchmark yourself in minutes (check it out here). Using this, we ran a series of local load tests that mimicked a real-time streaming setup. The goal was simple: push a steady stream of user event data through a Kafka → GlassFlow → ClickHouse pipeline and observe how well it performs with meaningful data transformations applied along the way.
Pipeline Configuration
The setup followed a typical streaming architecture:
- Kafka handled the event stream, fed by synthetic user activity.
- GlassFlow processed the stream in real time, applying transformations before passing it downstream.
- ClickHouse served as the destination where all processed data was written and later queried.
Each test run spun up its own Kafka topics and ClickHouse tables automatically. Everything was cleaned up once the run was complete, leaving no leftover state. This kept the environment fresh and the results reliable.
Transformations Applied
As discussed in the previous section, to make the test more realistic, we applied a deduplication transformation using the event_id
field. The goal was to simulate a scenario where events could be sent more than once due to retries or upstream glitches. The deduplication logic looked for repeated events within an 8-hour window and dropped the duplicates before they hit ClickHouse.
No complex joins or filters were applied in this run, keeping the focus on how well GlassFlow could handle high event volumes and real-time processing with exactly-once semantics.
Monitoring and Observability Setup
Throughout the test, we kept a close eye on key performance metrics:
- Throughput — Events processed per second, from Kafka to ClickHouse.
- Latency — Time taken from ingestion to storage.
- Kafka Lag — How far behind the processor was from the latest Kafka event.
- CPU & Memory Usage — For each component in the pipeline.
These were visualized using pre-built Grafana dashboards that gave a live view into system behavior. It was especially useful for spotting bottlenecks and confirming whether back pressure or resource constraints were kicking in.
Test Execution
We ran multiple test iterations, each processing between 5 to 20 million records, with parallelism levels ranging from 2 to 12 workers. Around 10% of the events were duplicates, which tested the deduplication mechanism effectively. Additionally, we setup various configurable parameters that allowed us to test the limits of GlassFlow:
Parameter | Required/Optional | Description | Example Range/Values | Default |
---|---|---|---|---|
num_processes | Required | Number of parallel processes | 1-N (step: 1) | - |
total_records | Required | Total number of records to generate | 5,000,000-20,000,000 (step: 500,000) | - |
duplication_rate | Optional | Rate of duplicate records | 0.1 (10% duplicates) | 0.1 |
deduplication_window | Optional | Time window for deduplication | [“1h”, “4h”] | “8h” |
max_batch_size | Optional | Max batch size for the sink | [5000] | 5000 |
max_delay_time | Optional | Max delay time for the sink | [”10s”] | ”10s” |
For each parameter, you can either define a fixed value and go a step further and define a range to run multiple combinations of the test using the configured values. Here is a sample of configuration that you can setup when using our repository:
Each test ran until all records were processed, and the pipeline drained completely. By the end, we had a clear picture of how throughput and latency scaled with load—and how stable the system remained under pressure.
With the setup complete, let’s look at the results.
It’s Result Time!
We ran this benchmark by using the same GlassFlow pipeline across all the sets and setting different parameters as shown above. Here are the GlassFlow pipeline configurations we use:
Parameter | Value |
---|---|
Duplication Rate | 0.1 |
Deduplication Window | 8h |
Max Delay Time | 10s |
Max Batch Size (GlassFlow Sink - Clickhouse) | 5000 |
Now, as we discussed above, we look at a particular performance metrics to gauge how GlassFlow performs. Across all our tests, both the CPU and memory usage on our Mac remained stable and efficient even during extended test runs.
So, here are the results that we obtained:
Variant ID | #records (millions) | #Kafka Publishers (num_processes) | Source RPS in Kafka (records/s) | GlassFlow RPS (records/s) | Average Latency (ms) | Lag (sec) |
---|---|---|---|---|---|---|
load_9fb6b2c9 | 5.0 | 2 | 8705 | 8547 | 0.117 | 10.1 |
load_0b8b8a70 | 10.0 | 2 | 8773 | 8653 | 0.1156 | 15.04 |
load_a7e0c0df | 15.0 | 2 | 8804 | 8748 | 0.1143 | 10.04 |
load_bd0fdf39 | 20.0 | 2 | 8737 | 8556 | 0.1169 | 47.74 |
load_1542aa3b | 5.0 | 4 | 17679 | 9189 | 0.1088 | 260.55 |
load_a85a4c42 | 10.0 | 4 | 17738 | 9429 | 0.1061 | 495.97 |
load_5efd111b | 15.0 | 4 | 17679 | 9341 | 0.1071 | 756.49 |
load_23da167d | 20.0 | 4 | 17534 | 9377 | 0.1066 | 991.77 |
load_883b39a0 | 5.0 | 6 | 25995 | 8869 | 0.1128 | 370.57 |
load_b083f89f | 10.0 | 6 | 26226 | 9148 | 0.1093 | 710.97 |
load_462558f4 | 15.0 | 6 | 26328 | 9191 | 0.1088 | 1061.44 |
load_254adf29 | 20.0 | 6 | 26010 | 8391 | 0.1192 | 1613.62 |
load_0c3fdefc | 5.0 | 8 | 34384 | 8895 | 0.1124 | 415.78 |
load_3942530b | 10.0 | 8 | 33779 | 8747 | 0.1143 | 846.26 |
load_d2c1783c | 15.0 | 8 | 34409 | 9067 | 0.1103 | 1217.37 |
load_febf151f | 20.0 | 8 | 35135 | 9121 | 0.1096 | 1622.75 |
load_993c0bc5 | 5.0 | 10 | 40256 | 8757 | 0.1142 | 445.76 |
load_022e44e5 | 10.0 | 10 | 38715 | 8687 | 0.1151 | 891.8 |
load_0adbae83 | 15.0 | 10 | 39820 | 8694 | 0.115 | 1347.66 |
load_77d67ac7 | 20.0 | 10 | 40458 | 8401 | 0.119 | 1885.24 |
load_af120520 | 5.0 | 12 | 37691 | 8068 | 0.124 | 485.95 |
load_c9424931 | 10.0 | 12 | 45743 | 8610 | 0.1161 | 941.66 |
load_ee837ca6 | 15.0 | 12 | 45539 | 8605 | 0.1162 | 1412.48 |
load_ac40b143 | 20.0 | 12 | 49005 | 8878 | 0.1126 | 1843.61 |
load_675d04f3 | 5.0 | 12 | 40382 | 8467 | 0.1181 | 465.66 |
load_28956d50 | 10.0 | 12 | 55829 | 8018 | 0.1247 | 1066.62 |
Note: The last two tests (load_675d04f3 and load_28956d50) use a higher records per second value to see how it would impact the performance.
Well, before we analyze these results, let’s take a look at few visualizations we created to get a better idea of how GlassFlow actually performed:
After running a series of sustained load tests, the results gave a clear picture of how GlassFlow behaves under pressure—and the performance was impressive across the board. Here's what stood out:
- Throughout the test, the system remained rock-solid—even when pushing up to 55,000 records per second into Kafka. There were no crashes, memory leaks, or failures. GlassFlow handled deduplication flawlessly, consistently filtering out repeated events without missing a beat. No message loss or disordering was observed, which speaks volumes about the reliability of the pipeline.
- GlassFlow’s processing rate remained stable under varying loads. In the current setup (running inside a Docker container on a local machine), the system consistently processed upwards of over 9,000 records per second.
However, this peak appears to be more a reflection of available system resources—CPU and memory—rather than a limitation of GlassFlow itself. With more powerful hardware or a scaled-out deployment (cloud deployment, for instance), it's likely this ceiling could be pushed higher. 3. Lag in the pipeline measured as the time difference between event ingestion into Kafka and its appearance in ClickHouse was closely tied to two factors:
- Ingestion Rate: Higher Kafka ingestion RPS naturally led to higher lag, especially when it exceeded the 9,000 RPS GlassFlow could sustain.
- Volume of Data: For a fixed RPS, increasing the total number of events extended the lag over time, which was expected as the buffer filled up.
In other words, once Kafka was producing faster than GlassFlow could consume, the lag started to climb. This is normal in streaming systems and highlights where autoscaling or distributed processing would come into play in a production setup.
So, to summarize the above interpretations, here are my final takeaways:
- GlassFlow remained stable and consistent under high event rates.
- Processing throughput maxed out at ~9K RPS, limited by local machine resources.
- Processing latency remained extremely low (<0.12ms). Even at peak load and max event volume (20M records), latency didn’t spike.
- Lag increased proportionally with ingestion rates and event volume—no surprises, but a great signal for where scaling would help.
Hence, it’s fair to say that these results give us a lot of confidence in using GlassFlow for real-time event pipelines, especially when paired with a scalable backend like ClickHouse.
Conclusion
The above test proves that GlassFlow is indeed a great tool for real-time stream processing with ClickHouse and it seamlessly integrates with Kafka. Deduplication does not compromise performance, making GlassFlow suitable for correctness-critical analytics use cases.
Now, it’s time for you to get your hands dirty and create your own tests using our load test repository. Here is the link to the repo again for your reference: https://github.com/glassflow/clickhouse-etl-loadtest.