🚀 Getting Started with Glassflow’s ClickHouse ETL: A Local Setup with Docker
This article was created by Vimalraj Selvam and originally posted on his blog.
If you're working with ClickHouse for observability or analytics and looking for a clean, low-code way to stream and transform logs before they hit your database, Glassflow's clickhouse-etl might be the tool you're looking for.
In this blog post, I'll walk through setting up a local end-to-end ETL pipeline using Glassflow's clickhouse-etl UI/backend, NATS, Kafka, OpenTelemetry Collector as a Gateway, Fluent Bit, and ClickHouse - all tied together via Docker Compose.
Architecture Overview
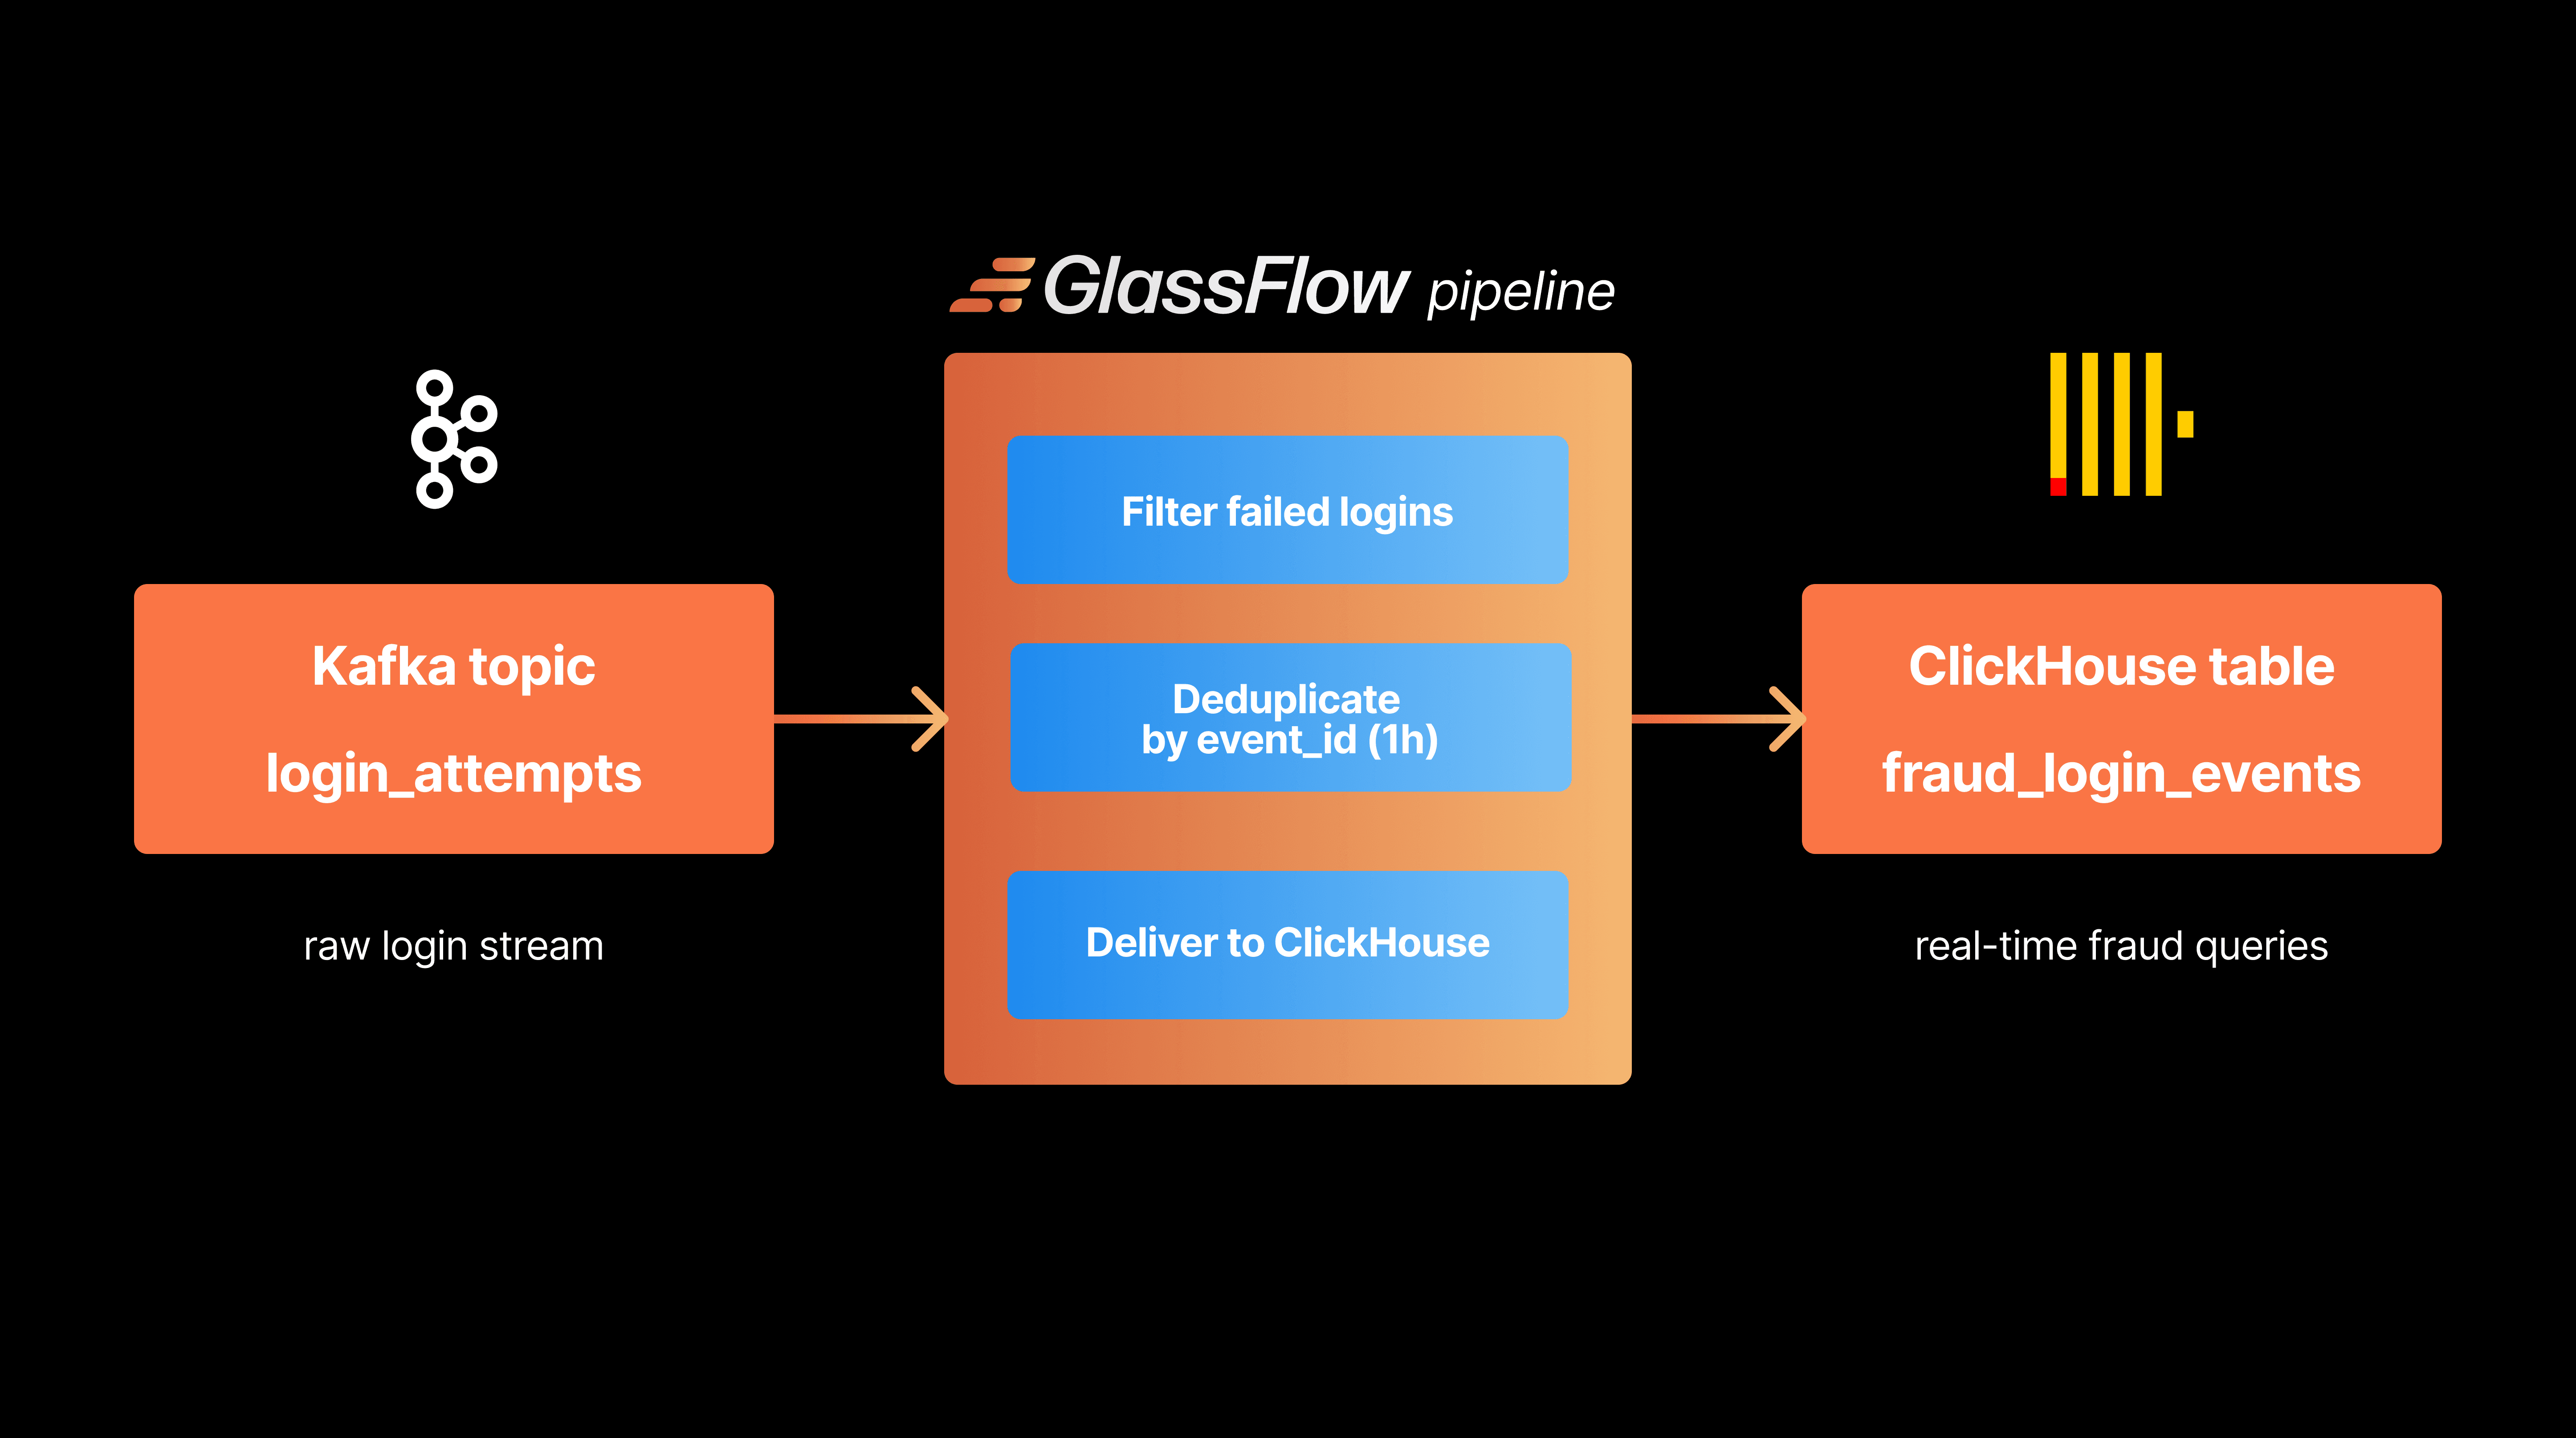
Here's the high-level flow:
[Fluent Bit] → [OTEL Collector] → [Kafka] → [Glassflow ETL (App + NATS)] → [ClickHouse]
[Fluent Bit] → [OTEL Collector] → [Kafka] → [Glassflow ETL (App + NATS)] → [ClickHouse]
[Fluent Bit] → [OTEL Collector] → [Kafka] → [Glassflow ETL (App + NATS)] → [ClickHouse]
Fluent Bit generates dummy logs and sends them via OTLP to OTEL Collector.
OTEL Collector batches and ships logs to Kafka in a raw format (why not OTLP? Discussed later).
Glassflow Backend listens to Kafka topics, allows transformation configs via UI, and writes into ClickHouse.
Glassflow UI provides a powerful interface to manage ETL jobs.
NATS acts as an internal messaging bus used by the Glassflow backend to orchestrate ETL job execution and event handling.
ClickHouse stores the final structured data.
🐳 Docker Compose Stack
The complete docker-compose.yaml file as follows:
services:
  nats:
    image: nats:alpine
    ports:
      - "4222:4222"
    command: --js
    restart: unless-stopped

  ui:
    image: glassflow/clickhouse-etl-fe:stable
    pull_policy: always
    environment:
      - NEXT_PUBLIC_API_URL=${NEXT_PUBLIC_API_URL:-http://app:8080/api/v1}
      - NEXT_PUBLIC_IN_DOCKER=${NEXT_PUBLIC_IN_DOCKER:-true}

  app:
    image: glassflow/clickhouse-etl-be:stable
    pull_policy: always
    depends_on:
      - nats
    restart: unless-stopped
    environment:
      GLASSFLOW_LOG_FILE_PATH: /tmp/logs/glassflow
      GLASSFLOW_NATS_SERVER: nats:4222
    volumes:
      - logs:/tmp/logs/glassflow

  nginx:
    image: nginx:1.27-alpine
    ports:
      - "8080:8080"
    depends_on:
      - ui
      - app
    volumes:
      - logs:/logs:ro
      - ./nginx:/etc/nginx/templates
    restart: unless-stopped
    environment:
      NGINX_ENTRYPOINT_LOCAL_RESOLVERS: "true"

  kafka:
    image: confluentinc/cp-kafka:7.9.0
    hostname: kafka
    container_name: kafka
    ports:
      - "9092:9092"
    environment:
      KAFKA_BROKER_ID: 1
      KAFKA_LISTENER_SECURITY_PROTOCOL_MAP: PLAINTEXT:PLAINTEXT,PLAINTEXT_EXTERNAL:PLAINTEXT,CONTROLLER:PLAINTEXT,PLAINTEXT_INTERNAL:PLAINTEXT
      KAFKA_ADVERTISED_LISTENERS: PLAINTEXT://kafka:29092,PLAINTEXT_EXTERNAL://localhost:9092,PLAINTEXT_INTERNAL://kafka:9093
      KAFKA_OFFSETS_TOPIC_REPLICATION_FACTOR: 1
      KAFKA_GROUP_INITIAL_REBALANCE_DELAY_MS: 0
      KAFKA_TRANSACTION_STATE_LOG_MIN_ISR: 1
      KAFKA_TRANSACTION_STATE_LOG_REPLICATION_FACTOR: 1
      KAFKA_PROCESS_ROLES: broker,controller
      KAFKA_NODE_ID: 1
      KAFKA_CONTROLLER_QUORUM_VOTERS: 1@kafka:29093
      KAFKA_LISTENERS: PLAINTEXT://kafka:29092,CONTROLLER://kafka:29093,PLAINTEXT_EXTERNAL://0.0.0.0:9092,PLAINTEXT_INTERNAL://0.0.0.0:9093
      KAFKA_INTER_BROKER_LISTENER_NAME: PLAINTEXT
      KAFKA_CONTROLLER_LISTENER_NAMES: CONTROLLER
      KAFKA_LOG_DIRS: /tmp/kraft-combined-logs
      CLUSTER_ID: MkU3OEVBNTcwNTJENDM2Qk

  clickhouse:
    image: clickhouse/clickhouse-server
    user: "101:101"
    container_name: clickhouse
    hostname: clickhouse
    ports:
      - "8123:8123"
      - "9000:9000"
    volumes:
      - ../config/clickhouse/config.d/config.xml:/etc/clickhouse-server/config.d/config.xml
      - ../config/clickhouse/users.d/users.xml:/etc/clickhouse-server/users.d/users.xml

  otel-collector:
    image: otel/opentelemetry-collector-contrib:latest
    volumes:
      - ./otel/otel-config.yaml:/etc/otel-config.yaml
    command: ["--config=/etc/otel-config.yaml"]
    depends_on:
      - kafka
    ports:
      - "4317:4317"
      - "4318:4318"

  fluentbit:
    image: cr.fluentbit.io/fluent/fluent-bit:4.0.1
    volumes:
      - ./fluent-bit/fluent-bit.conf:/fluent-bit/etc/fluent-bit.conf
      - ./fluent-bit/counter.lua:/fluent-bit/etc/counter.lua
    depends_on:
      - otel-collector
    command: ["/fluent-bit/bin/fluent-bit", "-c", "/fluent-bit/etc/fluent-bit.conf"]

volumes:
  logs
This includes:
fluentbit: generates and sends dummy logs
otel-collector: processes and exports logs to Kafka
kafka: queues raw log events
clickhouse: stores logs
app and ui: Glassflow backend and frontend
nats: internal messaging bus for the backend
nginx: reverse proxy
Run the full stack with:
Once it's up, access the Glassflow UI at http://localhost:8080.
🔥 Fluent Bit – Generating Logs with Timestamps
We use the dummy input and a Lua script that adds a counter and timestamp to every log.
fluent-bit.conf
[INPUT]
    Name    dummy
    Tag     test.logs
    Dummy   {"initial": "start"}
    Rate    1

[FILTER]
    Name    lua
    Match   test.logs
    script  /fluent-bit/etc/counter.lua
    call    gen_log

[OUTPUT]
    Name                    opentelemetry
    Match                   *
    Host                    otel-collector
    Port                    4318
    Logs_uri                /v1/logs
    Log_response_payload    true
    logs_body_key           $message
add_label app fluent-bit[INPUT]
Name dummy
Tag test.logs
Dummy {"initial": "start"}
Rate 1
[FILTER]
Name lua
Match test.logs
script /fluent-bit/etc/counter.lua
call gen_log
[OUTPUT]
Name opentelemetry
Match *
Host otel-collector
Port 4318
Logs_uri /v1/logs
Log_response_payload true
logs_body_key $message
add_label app fluent-bitcounter.lua
counter = 0

function gen_log(tag, timestamp, record)
    counter = counter + 1
    local new_record = {}
    new_record["timestamp"] = timestamp
    new_record["counter"] = counter
    new_record["msg"] = "Test log message #" .. counter
    return 1, timestamp, new_record
end
counter = 0
function gen_log(tag, timestamp, record)
counter = counter + 1
local new_record = {}
new_record["timestamp"] = timestamp
new_record["counter"] = counter
new_record["msg"] = "Test log message #" .. counter
return 1, timestamp, new_record
endcounter = 0
function gen_log(tag, timestamp, record)
counter = counter + 1
local new_record = {}
new_record["timestamp"] = timestamp
new_record["counter"] = counter
new_record["msg"] = "Test log message #" .. counter
return 1, timestamp, new_record
endThis setup emits logs like:
{
  "timestamp": 1719050000,
  "counter": 101,
  "msg": "Test log message #101"
}
{
"timestamp": 1719050000,
"counter": 101,
"msg": "Test log message #101"
}{
"timestamp": 1719050000,
"counter": 101,
"msg": "Test log message #101"
}📦 OpenTelemetry Collector: Kafka Exporter
The OTEL Collector handles log batching and delivery to Kafka.
otel-config.yaml
receivers:
  otlp:
    protocols:
      grpc:
      http:
        endpoint: 0.0.0.0:4318
processors:
  batch:
  memory_limiter:
    limit_mib: 100
    spike_limit_mib: 20
    check_interval: 5s
exporters:
  kafka:
    brokers: ["kafka:9093"]
    topic: "logs"
    encoding: raw

service:
  pipelines:
    logs:
      receivers: [otlp]
      processors: [memory_limiter, batch]
      exporters: [kafka]

telemetry:
  logs:
    level
NOTE
Observe that I'm using raw as encoding. The otlp_json encoding can't be used at this moment as Glassflow's clickhouse-etl is currently cannot process nested json structure.
🧩 ClickHouse – Schema to Store Logs
Create a table in ClickHouse for storing processed logs:
CREATE TABLE IF NOT EXISTS logs (
    event_timestamp DateTime,
    body String,
    counter Int32
) ENGINE = MergeTree
ORDER BY
CREATE TABLE IF NOT EXISTS logs (
    event_timestamp DateTime,
    body String,
    counter Int32
) ENGINE = MergeTree
ORDER BY
CREATE TABLE IF NOT EXISTS logs (
    event_timestamp DateTime,
    body String,
    counter Int32
) ENGINE = MergeTree
ORDER BY
This schema expects:
event_timestamp: UNIX timestamp derived from timestamp
body: Log message (from msg)
counter: A sequential value for ordering - I'm using to ensure no data loss while testing.
🌐 Glassflow ETL: UI‑Driven Pipeline Configuration
Once the UI is up at http://localhost:8080, you will be presented with the following nice welcome page:

Select Ingest Only for now. The Deduplicate option is very useful when you believe that your logs are duplicated. For my testing, I just use Ingest Only, and we can dig into each options in another post.
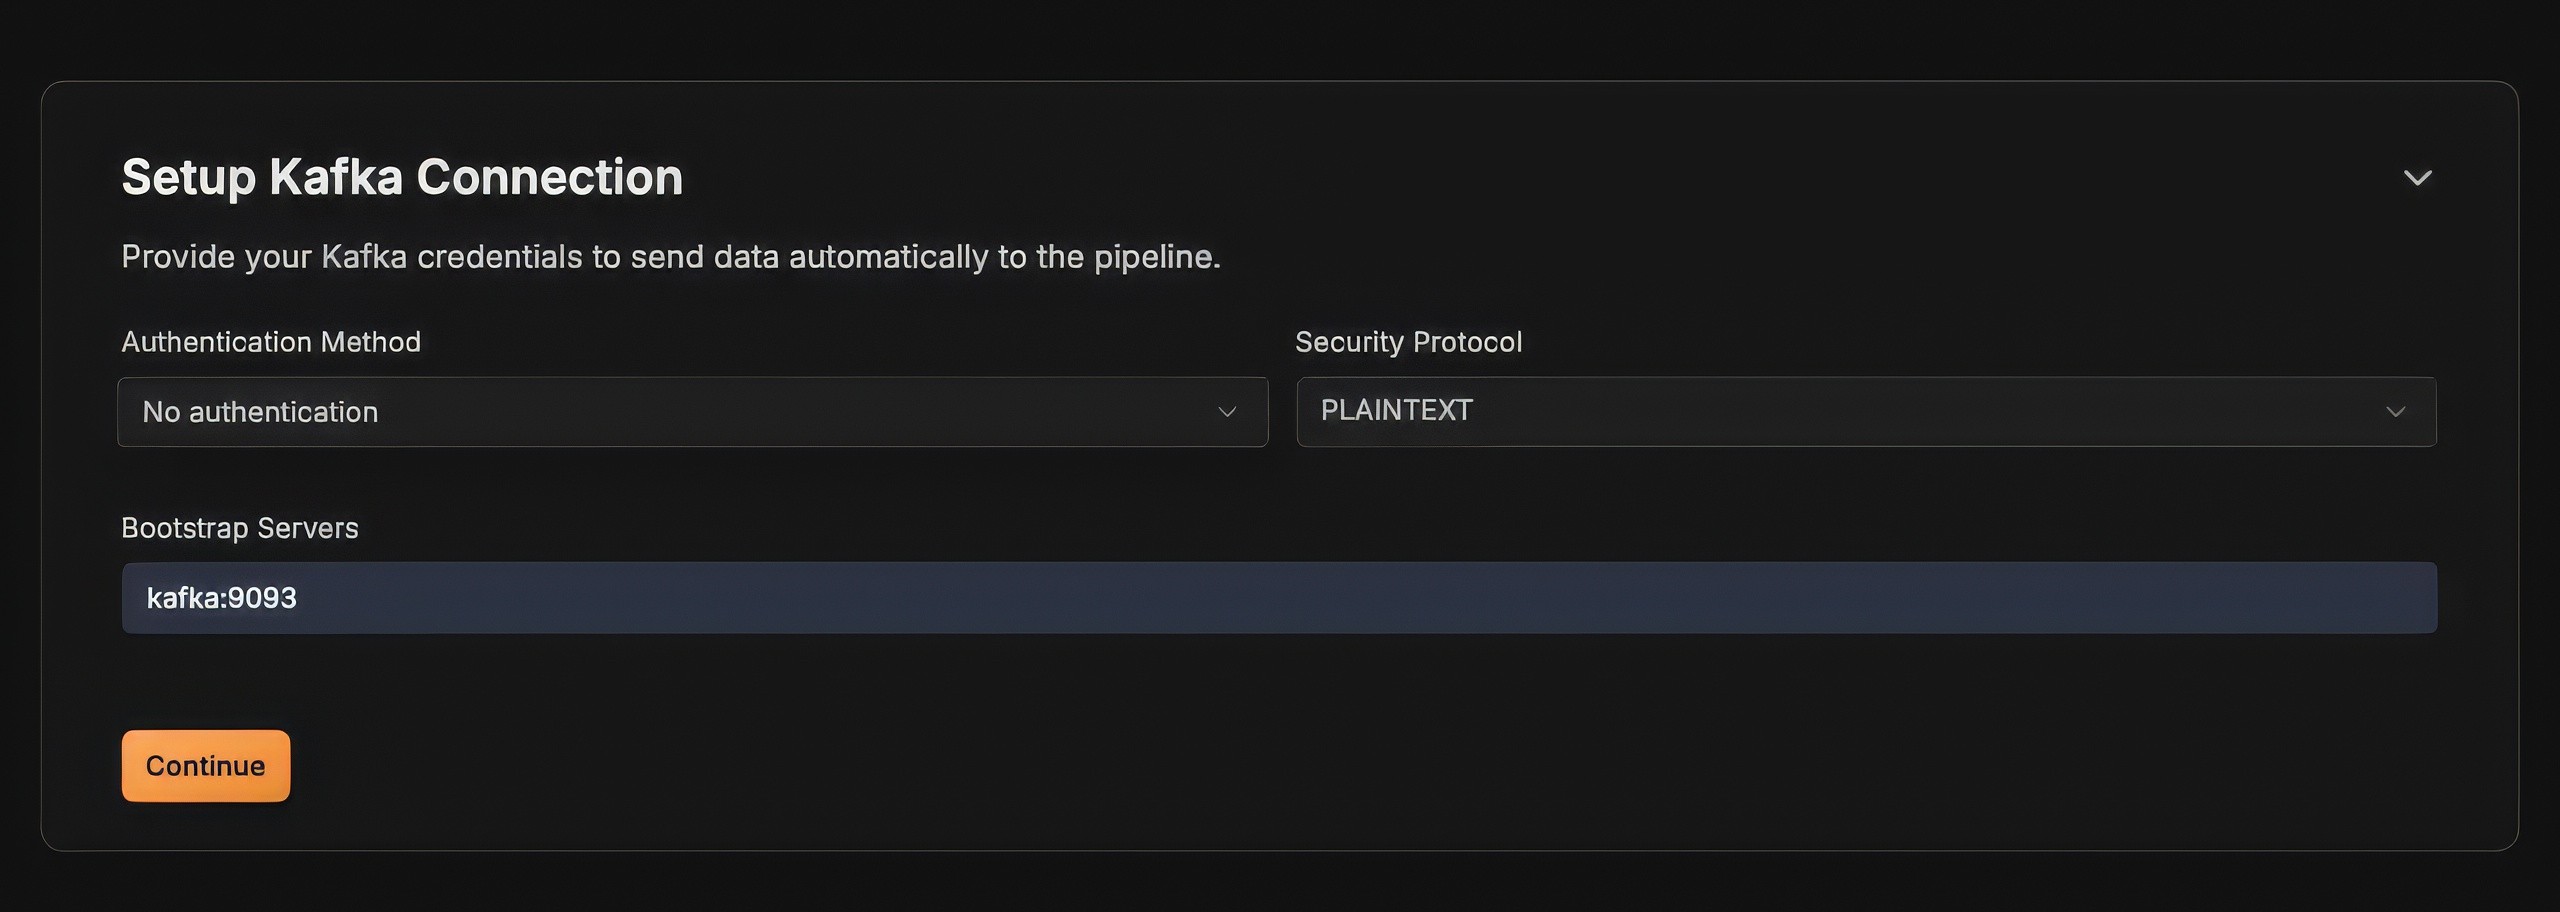
Now setup the Kafka Connection, we use no authentication option for our local setup, hence select the No authentication option (🙏 Thank you for the Glassflow developers for the quick feature addition on this to enable local testing easier).
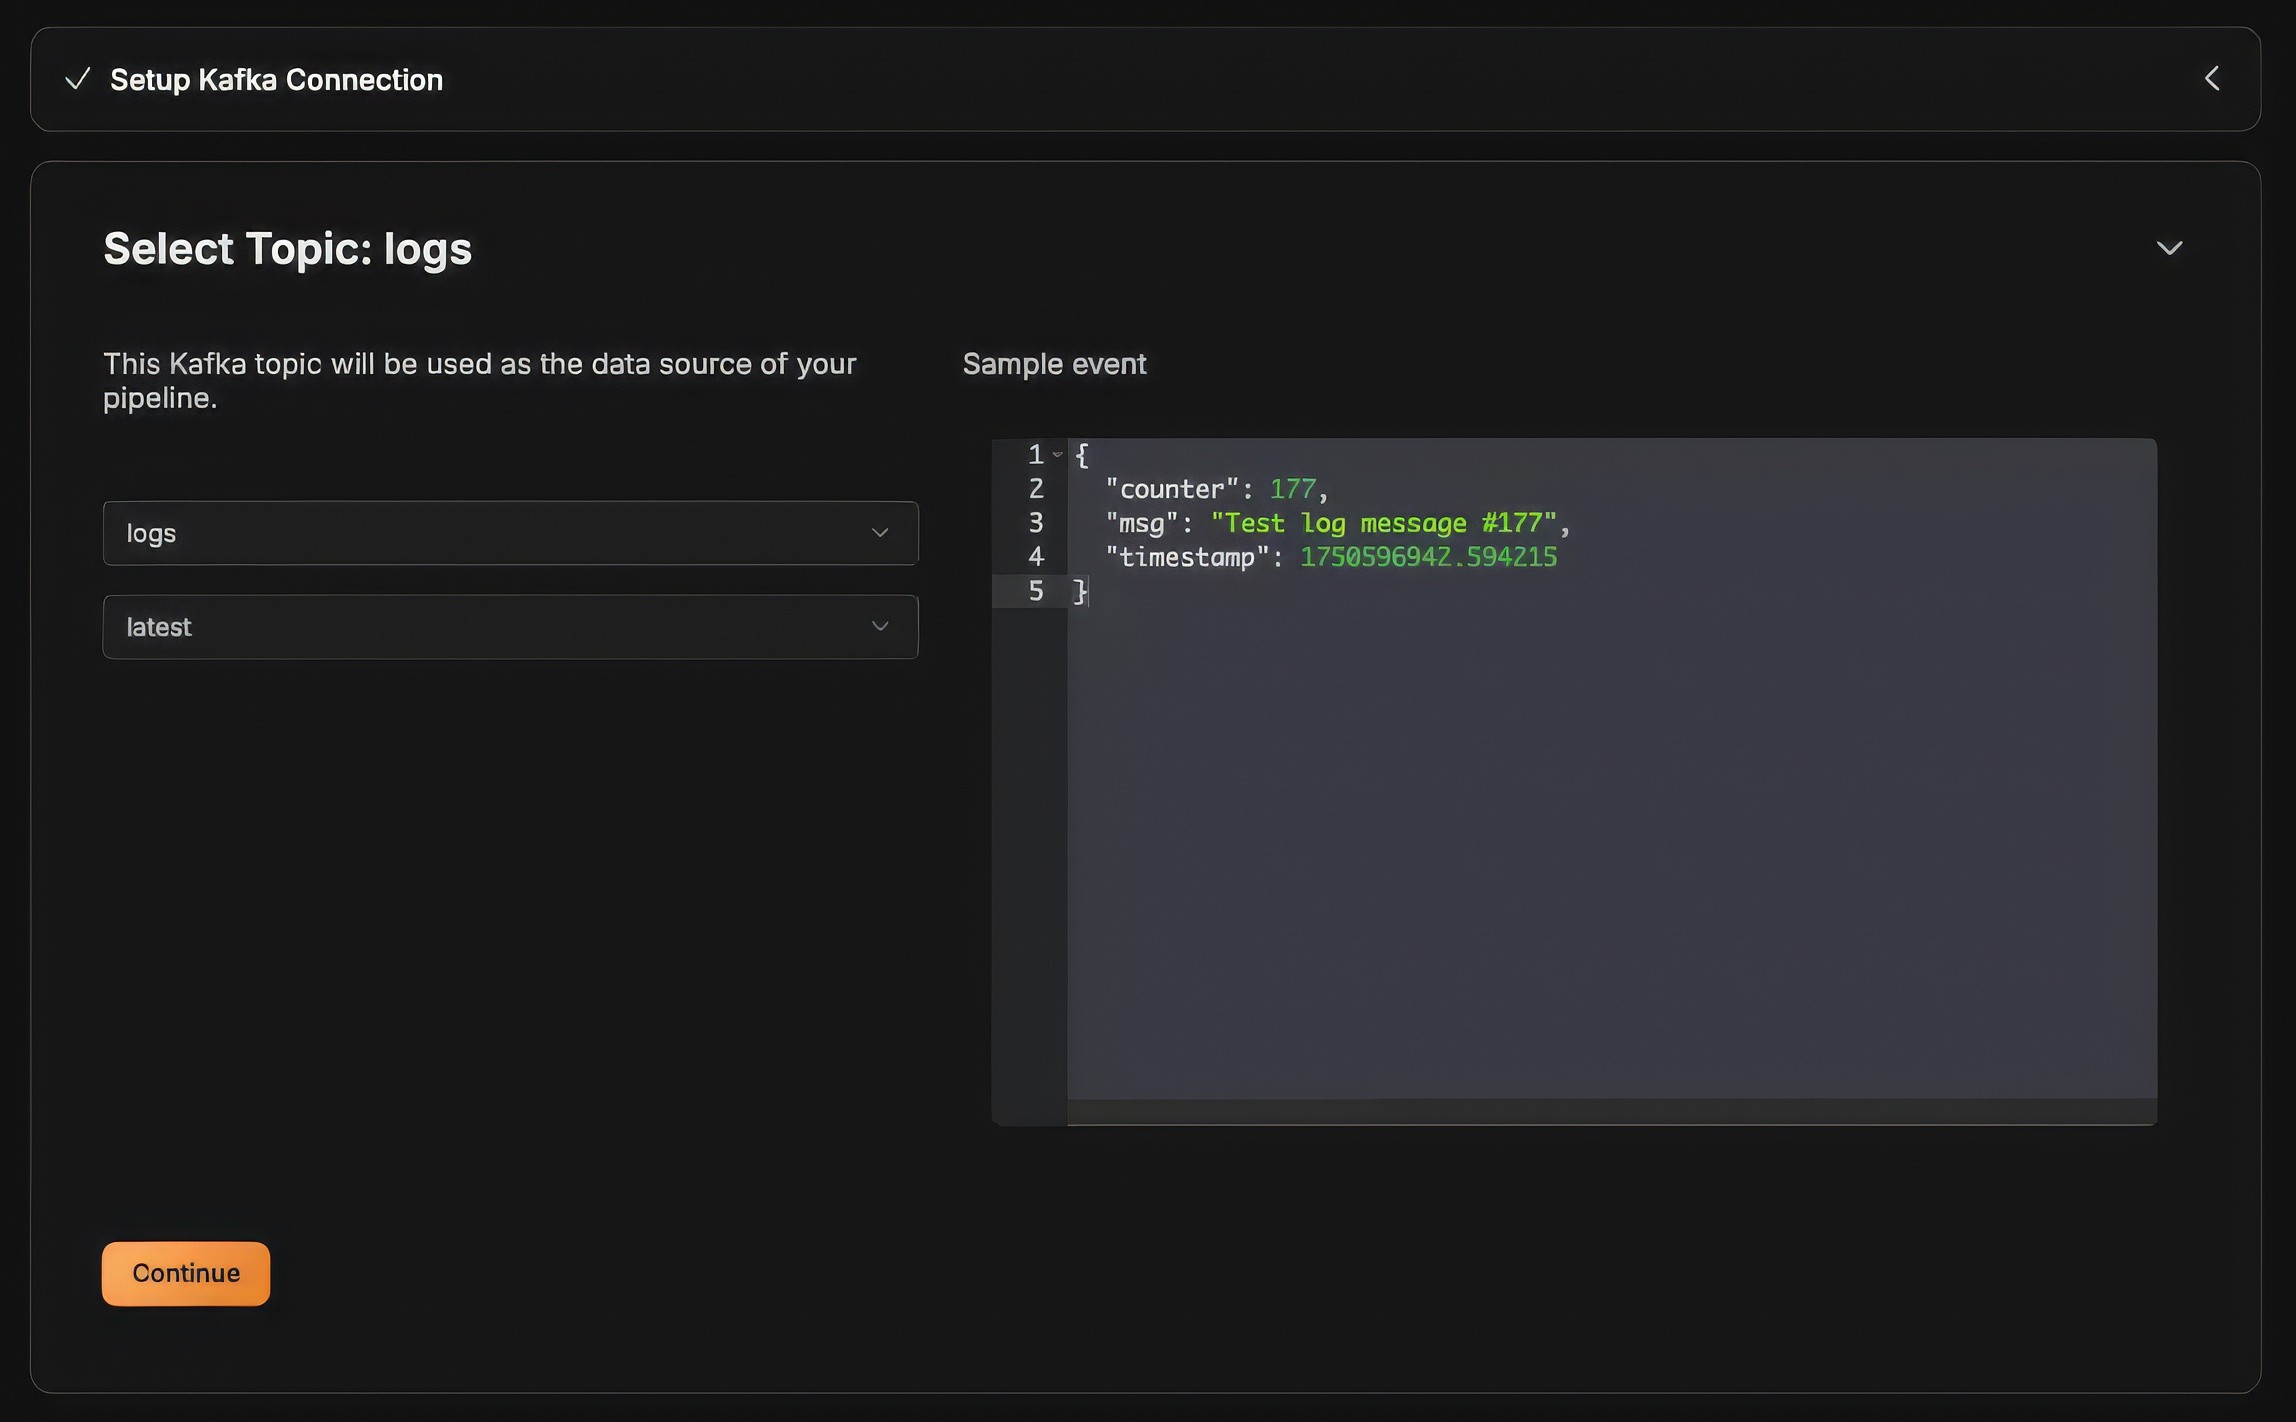
Once the Kafka connection is setup, now select the topic where the logs are produced and select the offset either earliest or latest.
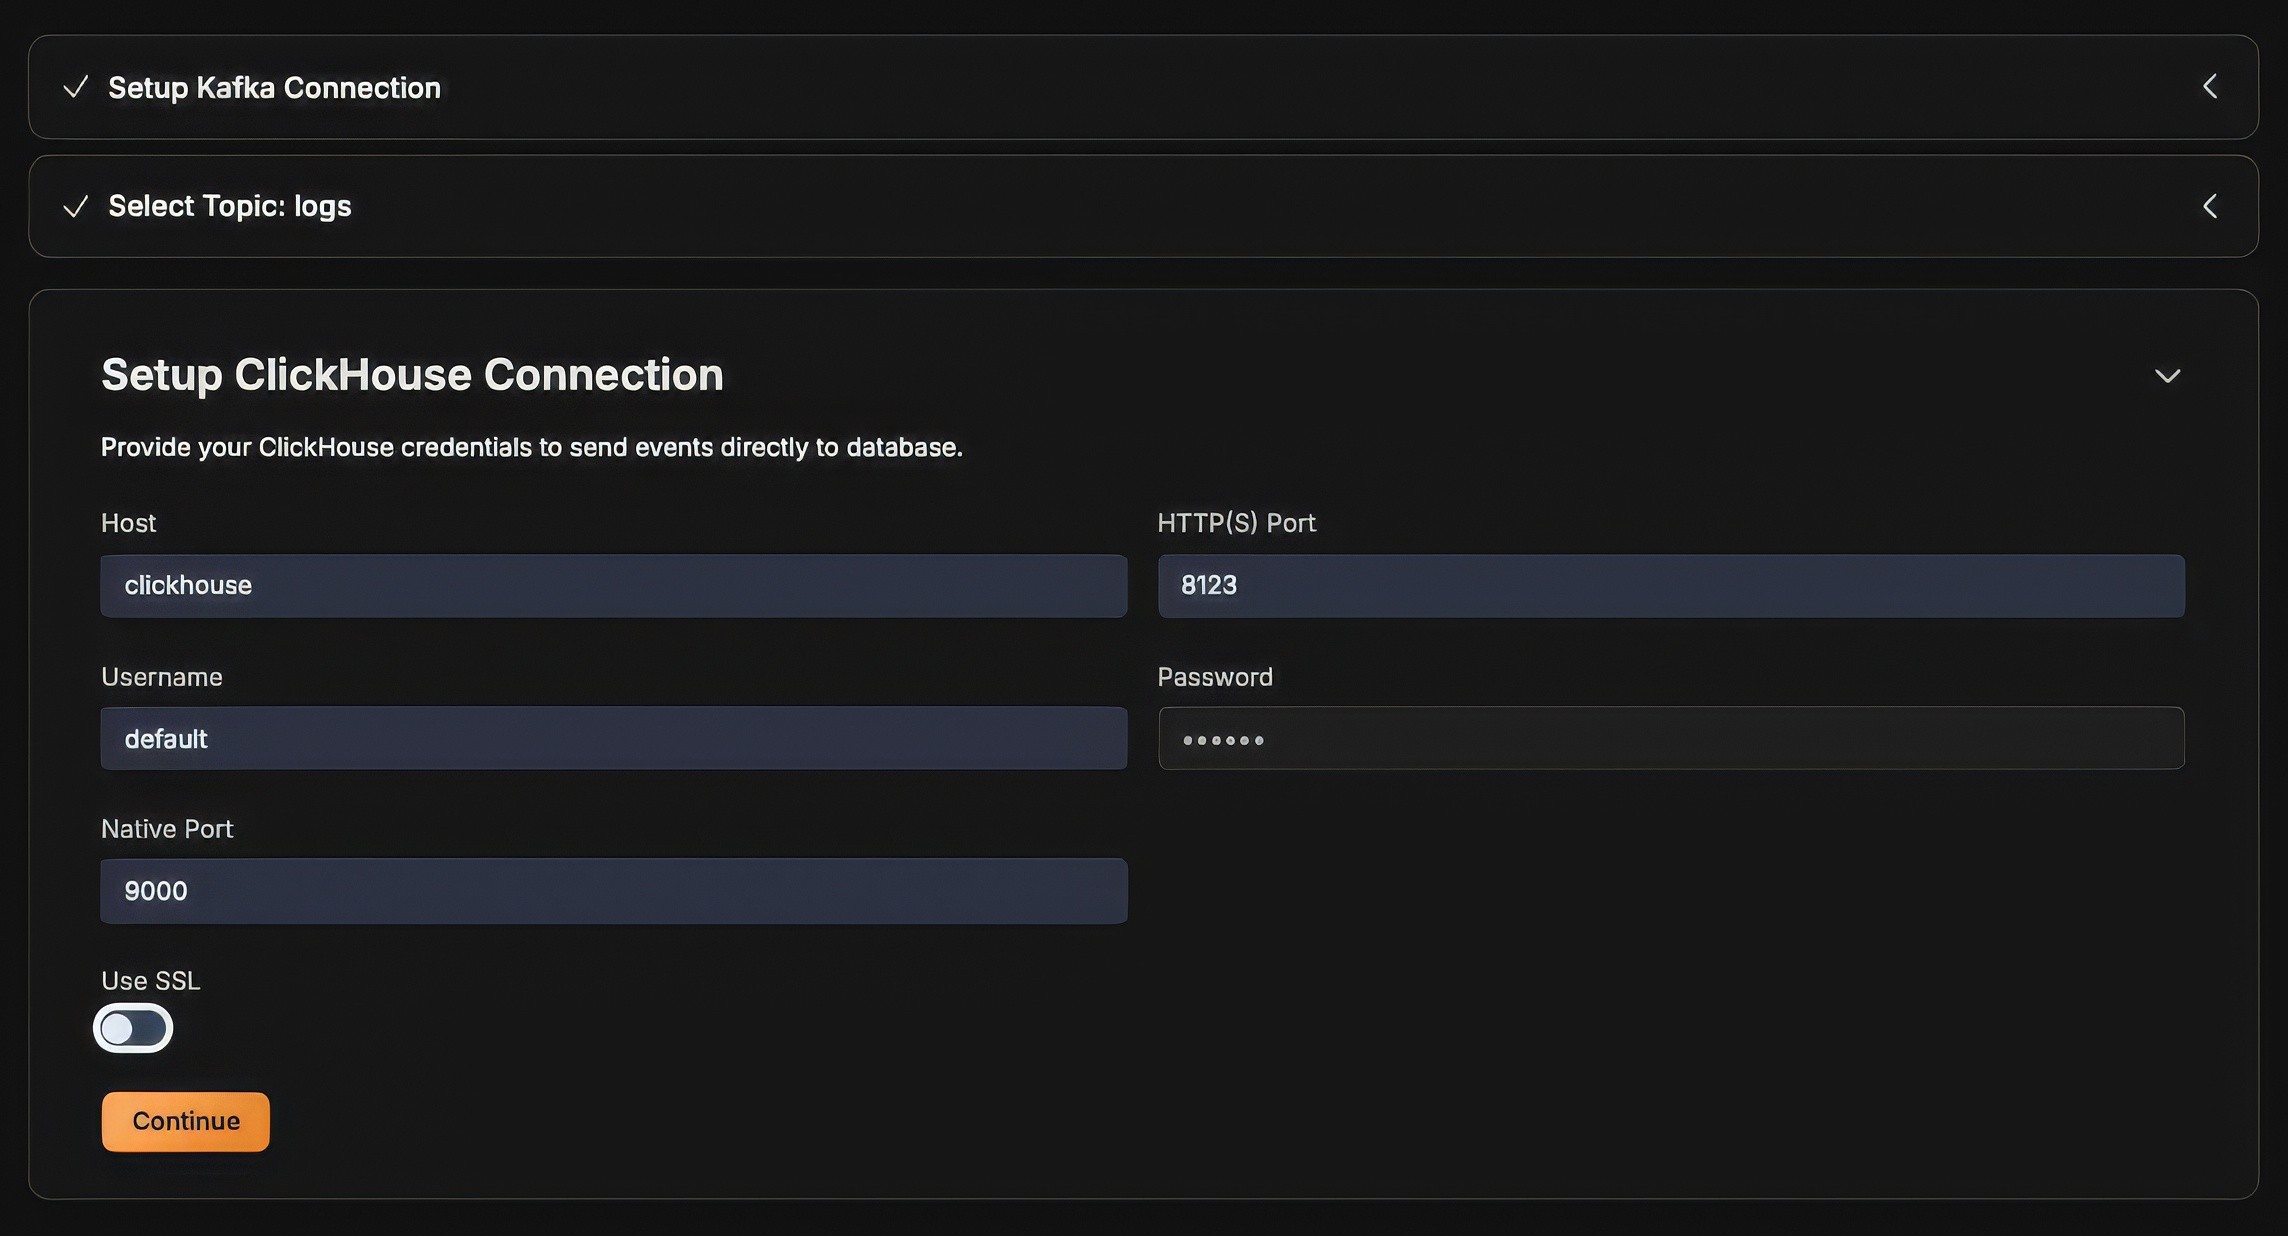
Next step is to setup the ClickHouse connection:
On the final step, select the database and the destination table as follows:
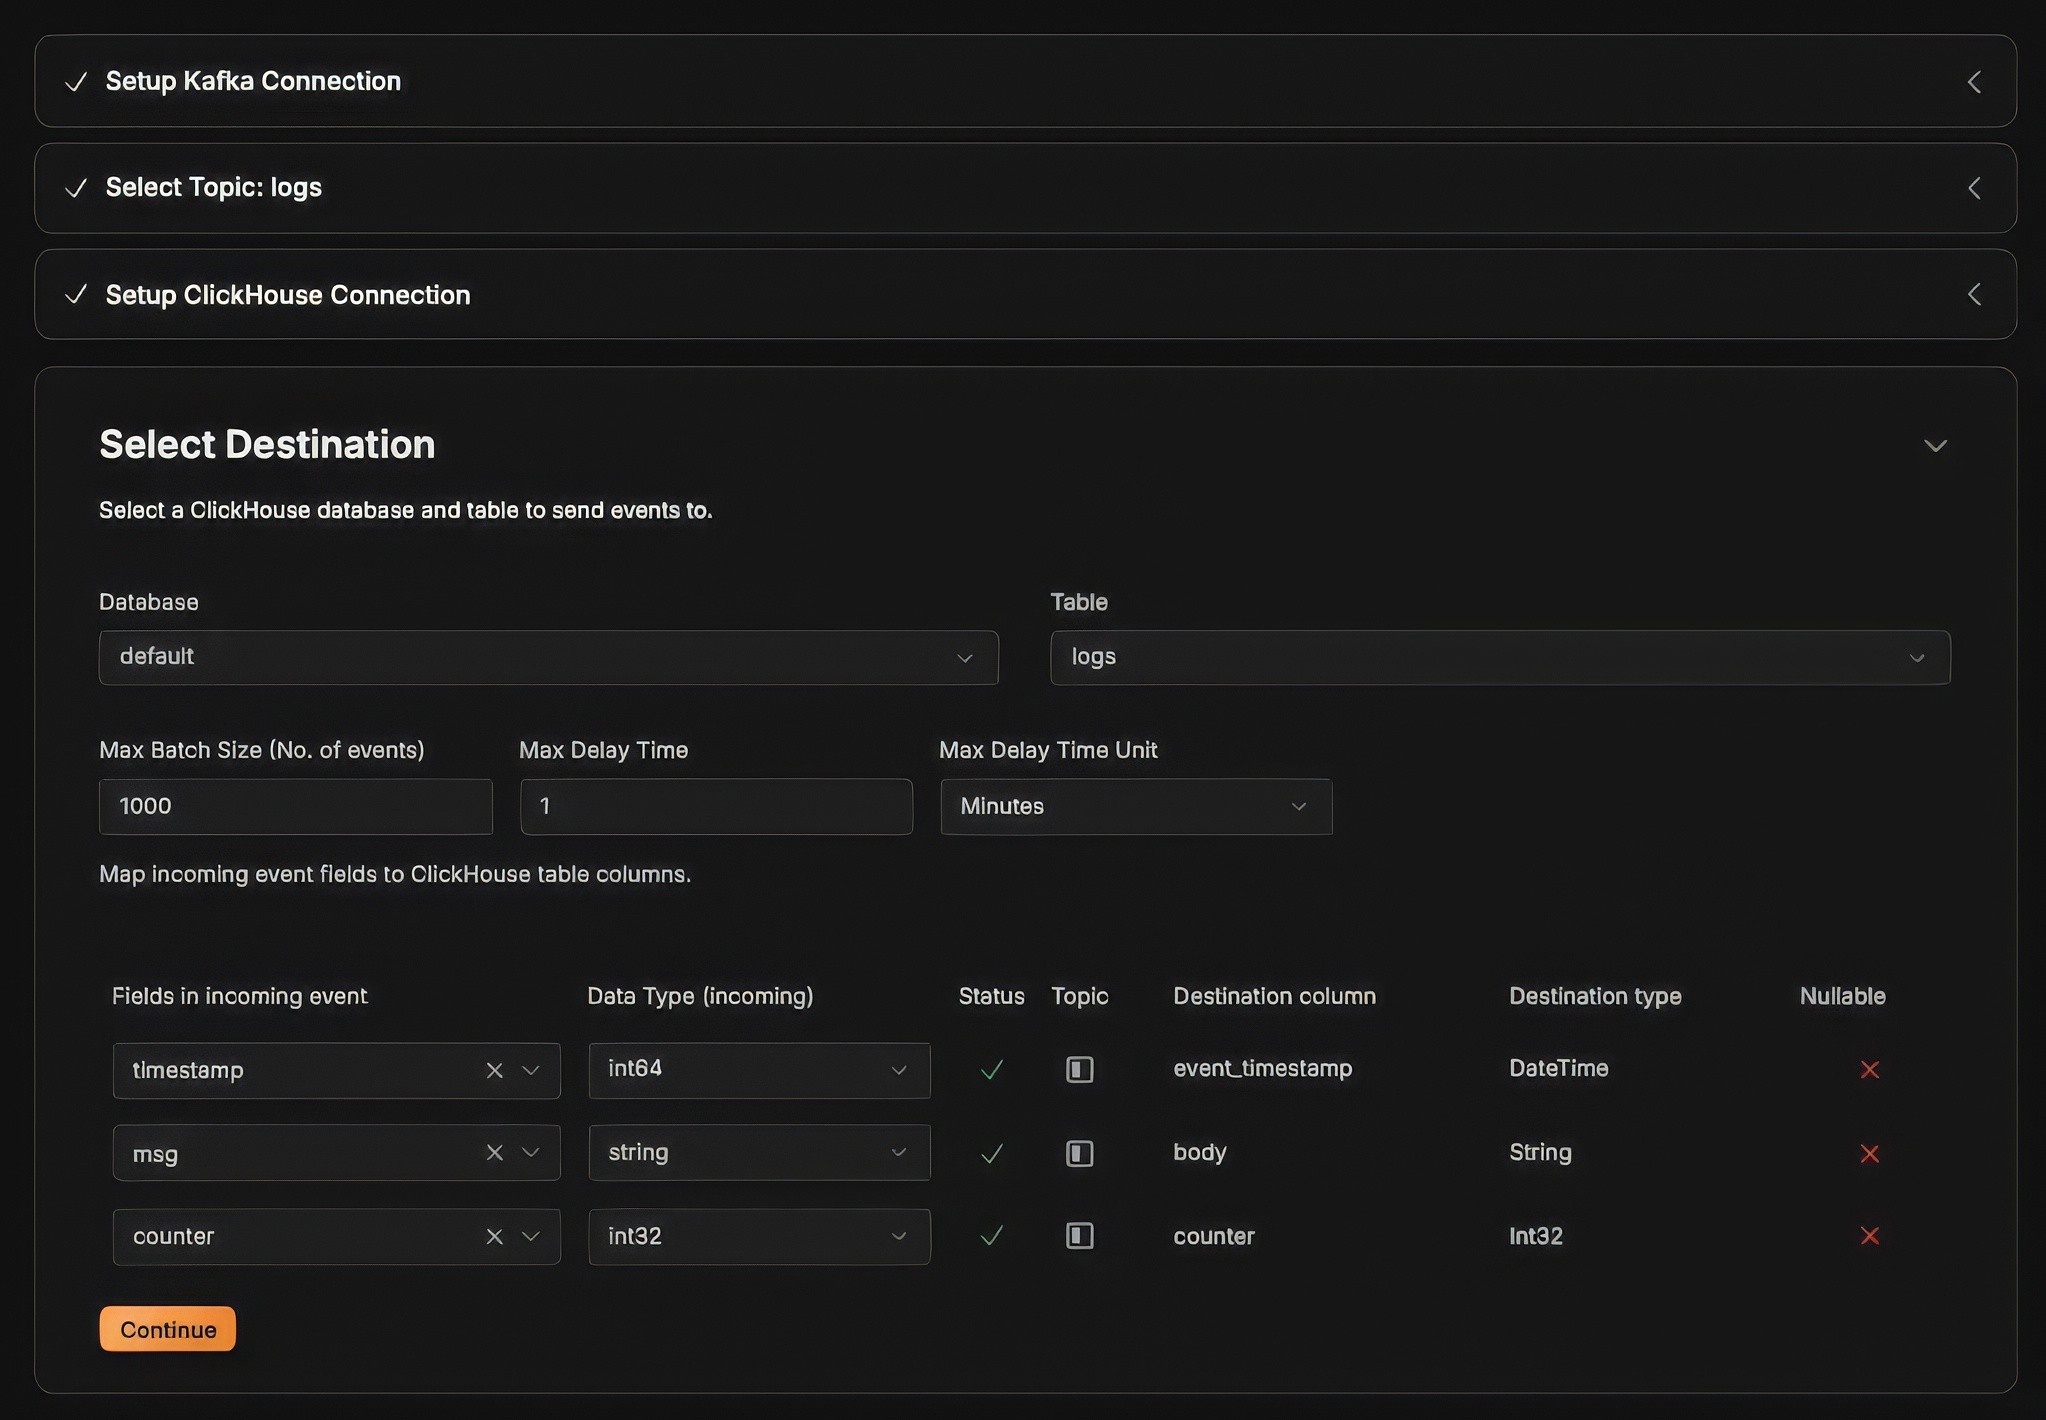
Once you saved the pipeline, then you can head to your ClickHouse play interface and query the logs:
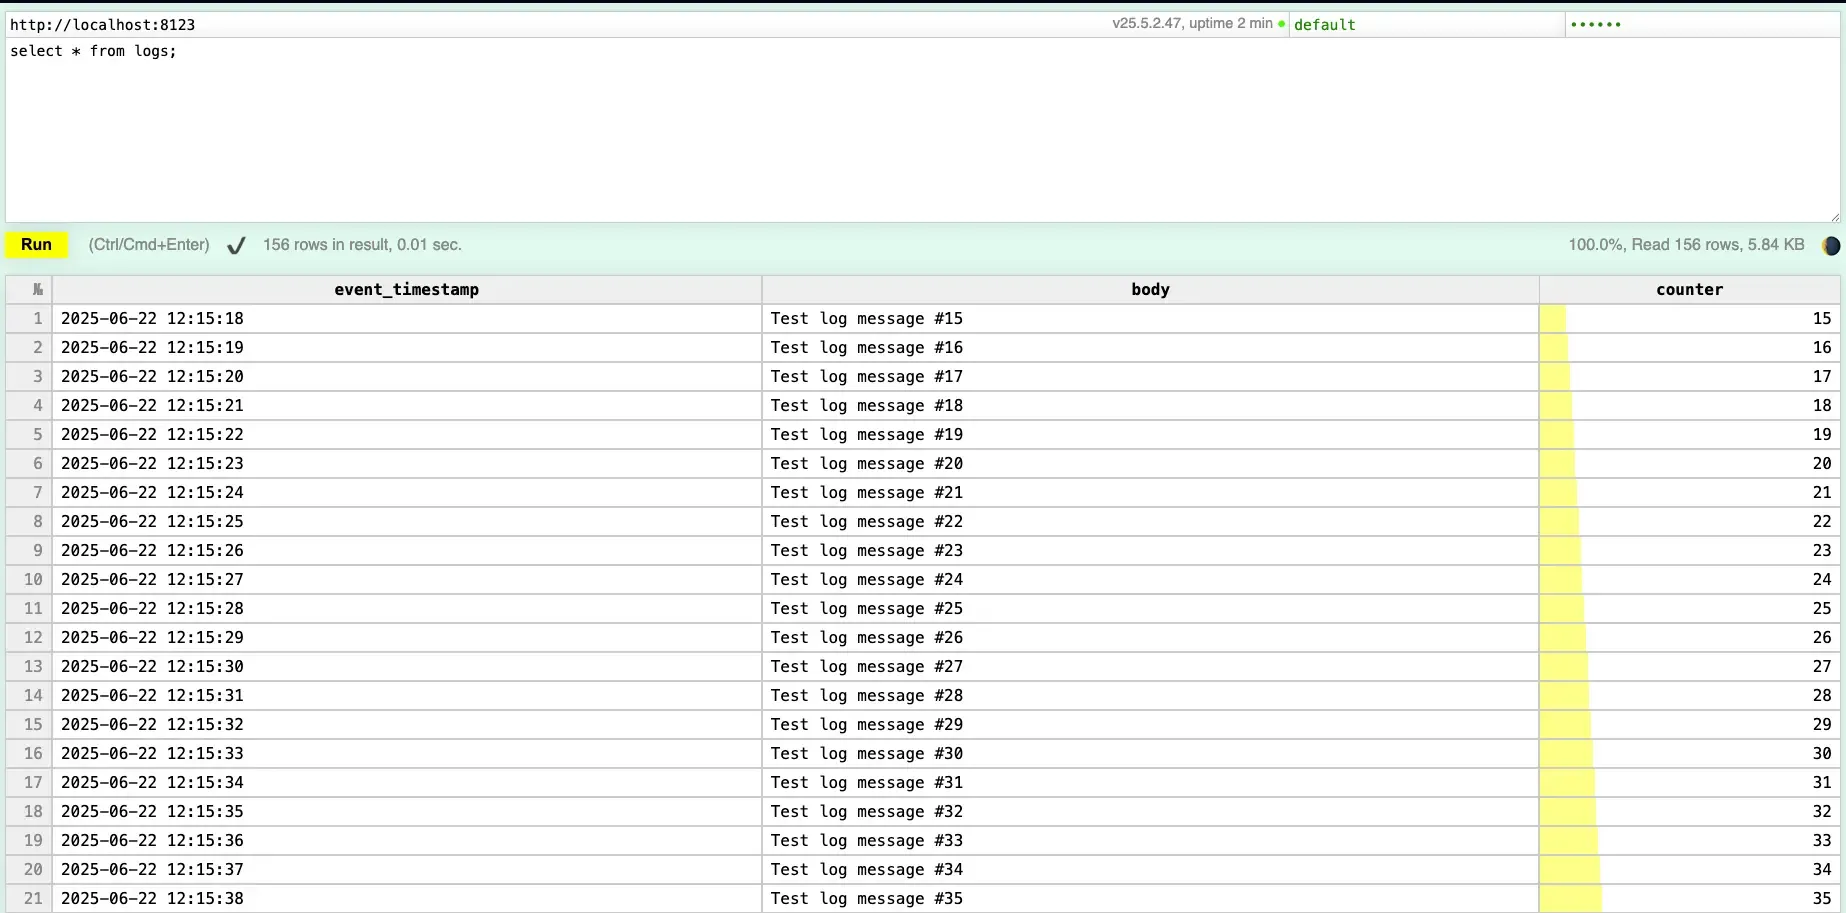
As you see, it is quite easy to setup and use the UI to select and transform the data as per your need.
All the working e2e configurations are available here - Part 1
📌 Final Thoughts
Glassflow’s clickhouse-etl offers a powerful abstraction layer for streaming logs from Kafka into ClickHouse. It’s ideal for building observability pipelines, troubleshooting tools, or analytics systems. With its visual UI, modular backend, and native Kafka support, it enables rapid prototyping and production deployments with minimal friction.
Glassflow team has a very good roadmap lined up to add more features, the features which I'm more interested and waiting for are:
Support for multiple pipelines (the feature is already in progress)
Real-time ingestion view
Field transformations / aggregations / filtering through UI
I strongly believe that the team behind Glassflow is adding more features and enabling us to create more powerful pipelines.
🔗 References