ljn
Observability
How ClickHouse powers observability at AI scale: Fast, efficient and ready for growth
Written by
Armend Avdijaj
-

Introduction: AI Logging Era
In the AI era, every interaction with a model - whether a prompt submission, token generation, embedding lookup, or response rendering - generates numerous logs. Behind the scenes, systems emit logs, traces, metrics, and metadata: input/output pairs, latency histograms, per-token timing, model internals, routing decisions, retries, feature flags, and much more. Modest operational logs have snowballed into massive, messy streams of structured and unstructured data.
As AI adoption spreads across more user-facing, backend, and automation workloads, the volume of observability data is exploding. Traditional log-and-observability systems were not built for this scale or structure, and in many cases are starting to strain under the load or are just way to expensive. Here are a few examples from the Internet:
Engineering teams report that traditional systems become cost-inefficient and brittle at scale. As clusters grow, infrastructure and operational overhead balloon, while search/query latency and indexing lag become harder to manage. Source: Akamai
In fact, recent engineering blogs note that even medium-sized customers can generate over 100,000 log entries per second, with millions of traces and terabytes of telemetry daily. Source: Groundcover
Observability surveys consistently place data volume and tooling costs among the top pain points: 84% of enterprises cite “data volume / tool cost” as a major challenge. Datamation
Log-focused systems are also criticized for ballooning costs, degrading query performance, and suboptimal retention strategies as daily log volume climbs. Source: https://www.chaossearch.io/blog/elasticsearch-opensearch-challenges
This shift forces engineering and platform teams to rethink their observability stack architecture, especially when scaling for AI workloads. It’s no longer sufficient to bolt on higher throughput or a few extra nodes—teams must adopt fundamentally more scalable, efficient, and purpose-built solutions.
In the rest of this article, we’ll explore one such modern architecture: scaling logs with ClickHouse as the storage and query engine, and GlassFlow (or similar flow/trace processing layers) to manage the pipeline, retention, and query semantics.
Why ClickHouse for AI Logging?
Before we start with GlassFlow, let’s understand why ClickHouse should be used for AI logging? Well, let’s do the most obvious thing and search how the leading AI companies solved this problem! Anthropic, the creator of Claude, actually used ClickHouse to manage the massive AI logging requirement they had, which they discussed in the following article.
I really like the quote from this article which showcases the importance of scaling in Observability:
"What happens when you have a whole lot of data?" Maruth asks. "Your database catches fire. Queries start timing out. Engineers start getting frustrated. Money catches fire.”
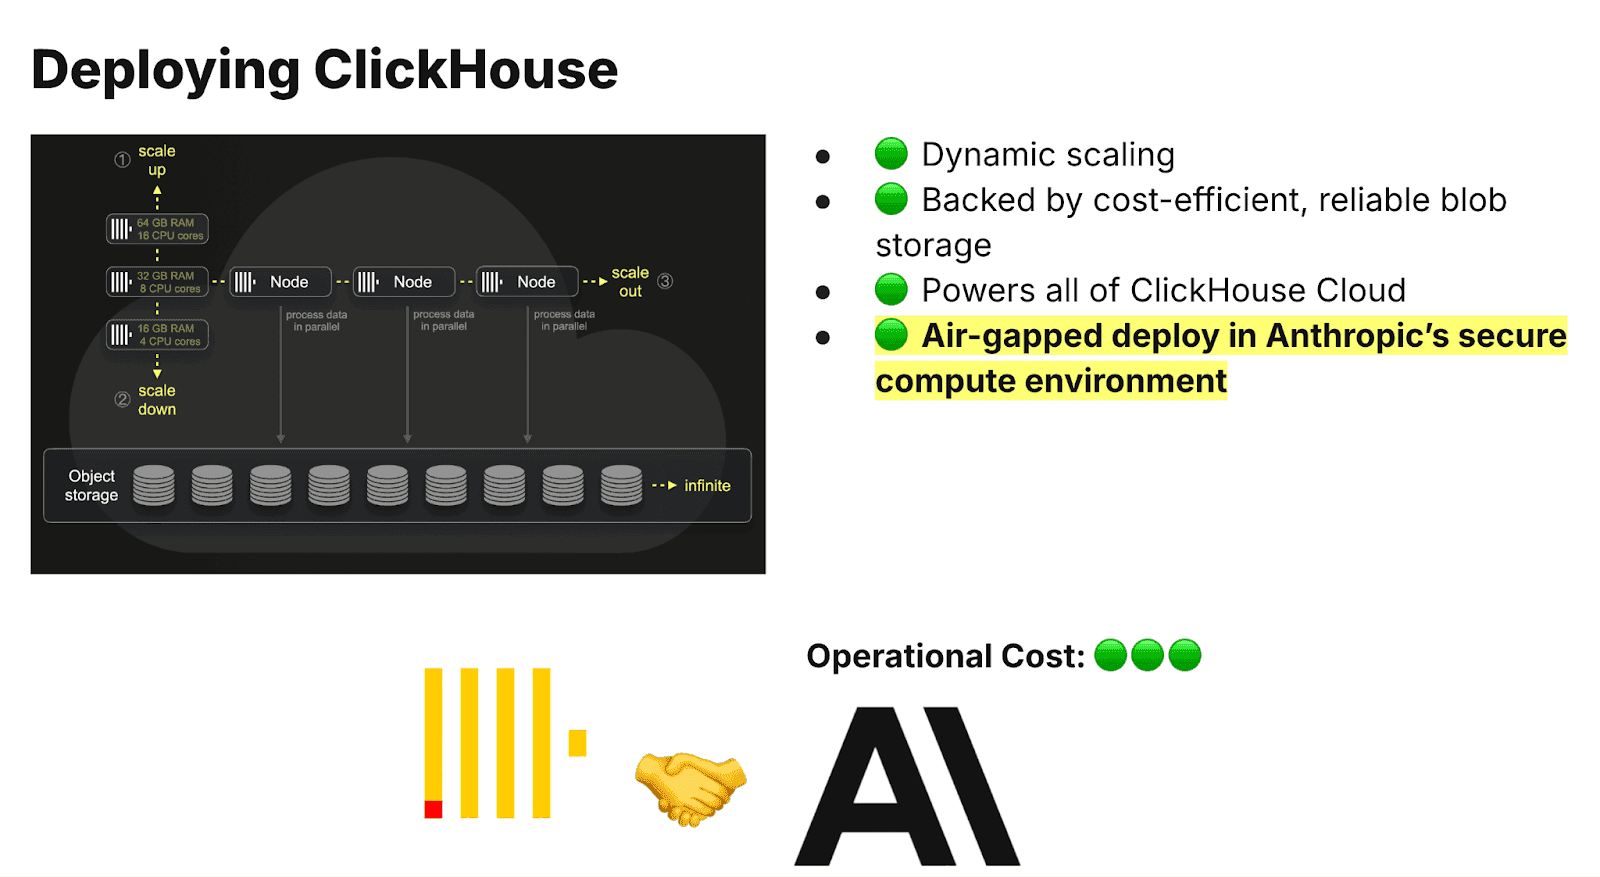
Now, what to do when you run into a problem like this? Easy, ask the AI you are building this solution for! (FYI, they actually did this..) So, after reading glowing recommendations, they finalized ClickHouse which fit their primary requirements really well:
Ability to Handle Gross Amounts of Data
Fast and Scalable
Can be deployed in Anthropic’s Environment
Low operational cost
Anthropic’s ClickHouse based AI Observability Solution
On top of that, ClickHouse now offers ClickStack, a high-performance open-source observability stack built on ClickHouse itself.ClickStack unifies logs, metrics, traces, and session replay in one architecture, powered by an opinionated OpenTelemetry ingestion pipeline and the HyperDX UI.Rather than stitching data across silos, ClickStack treats each telemetry signal as a “wide event” in ClickHouse, giving you fast cross-signal queries, native JSON support, and full correlation without the burden of building your own observability layer.
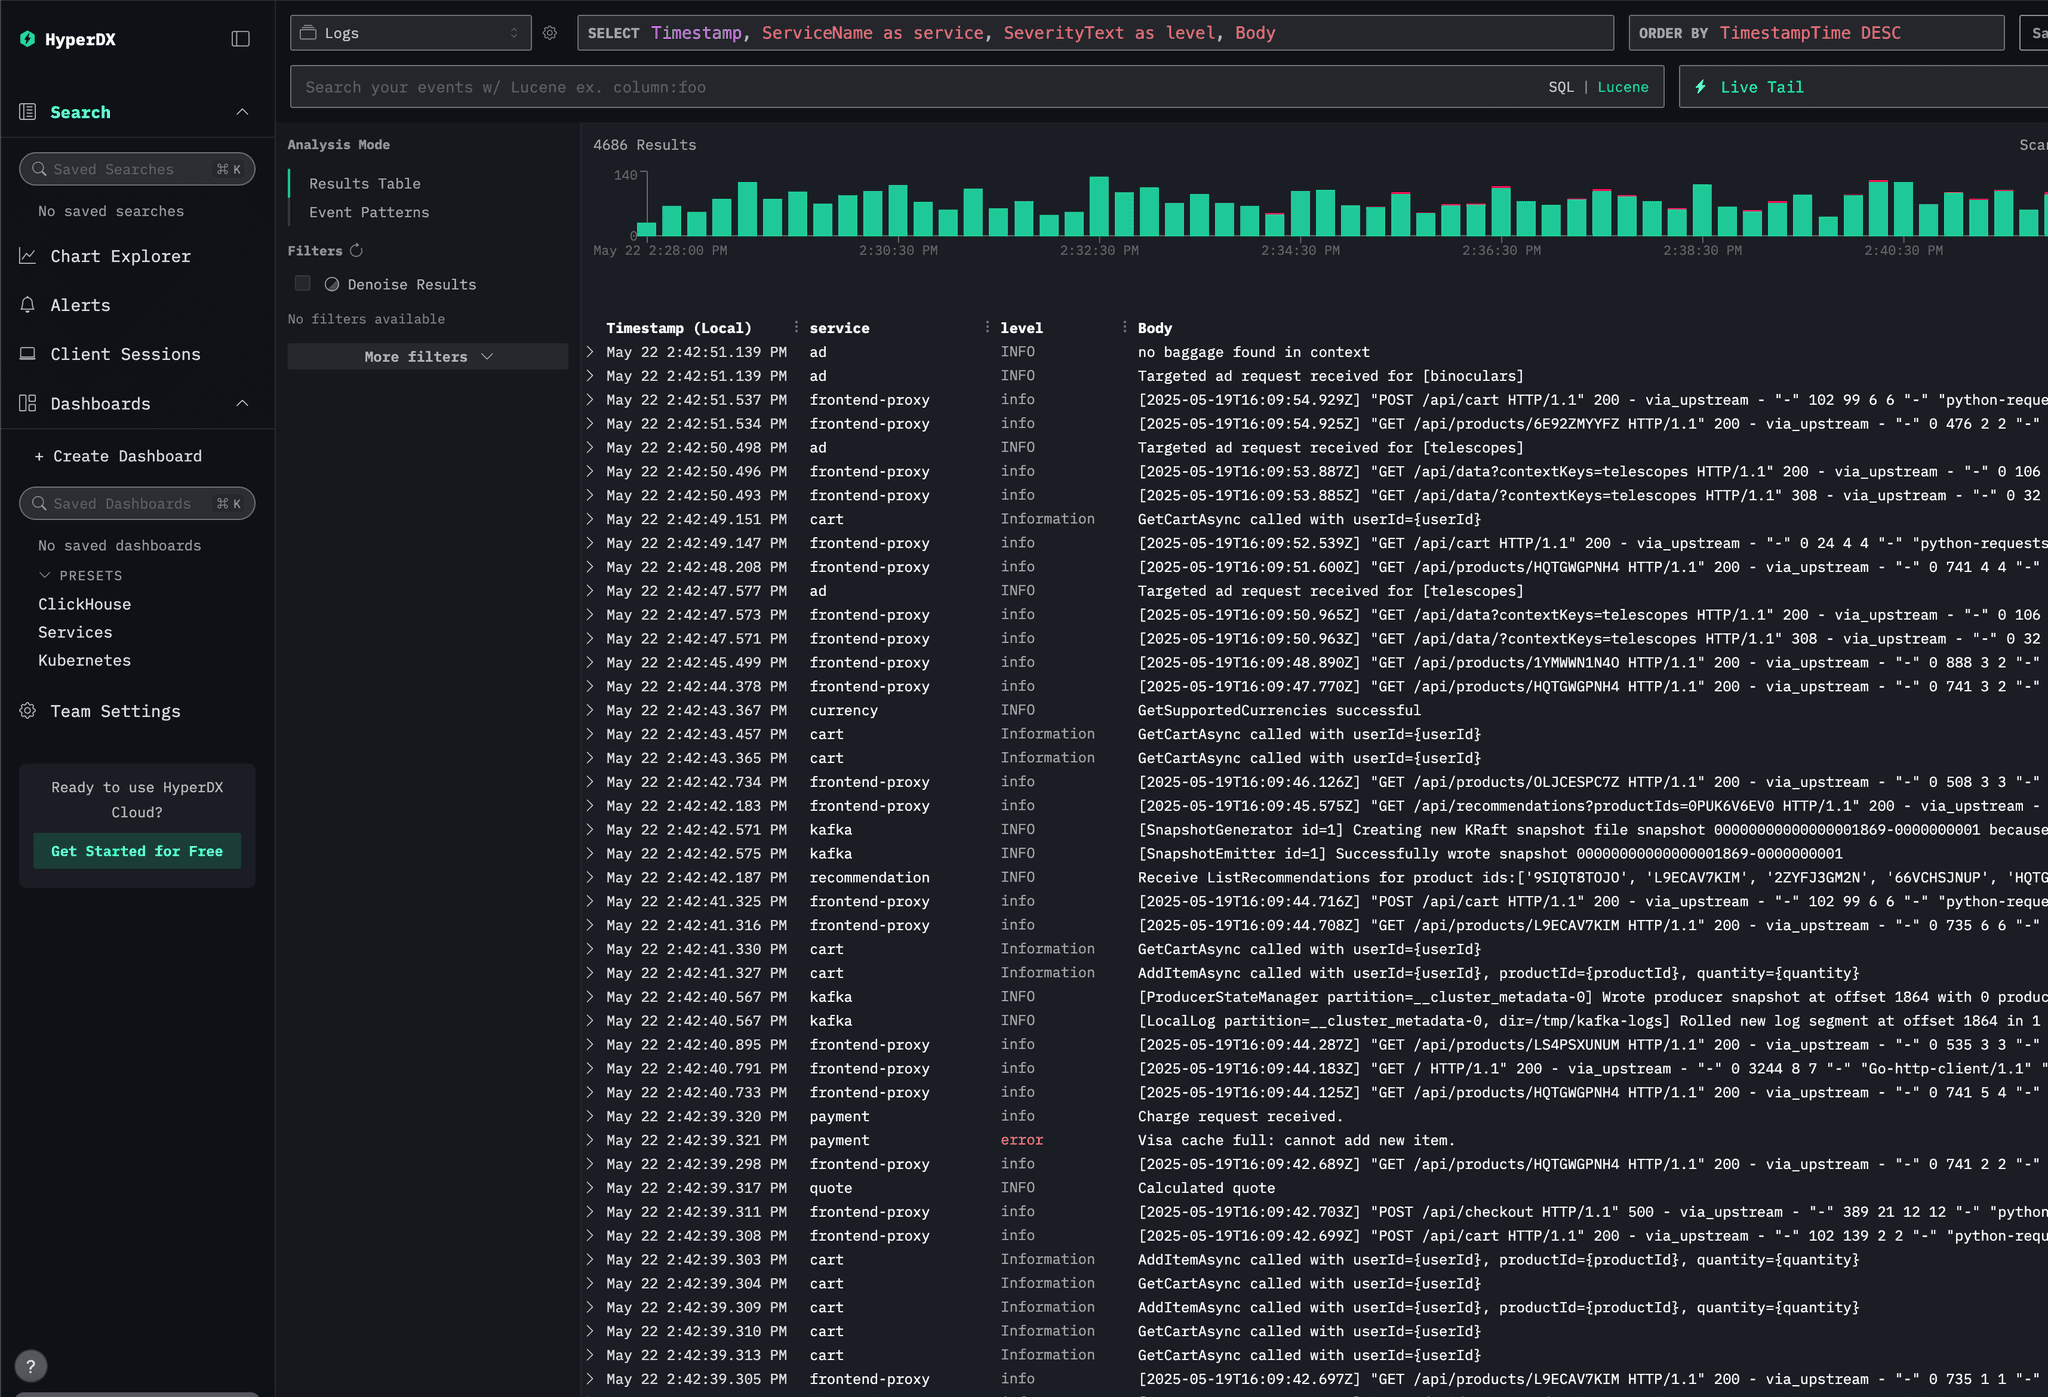
ClickStack by ClickHouse (https://clickhouse.com/docs/use-cases/observability/clickstack/getting-started/sample-data)
So, fast forward to now, Anthropic are one of the fastest growing AI startups and they managed to crack the AI Logging problem with a unique Hybrid ClickHouse Cloud deployment, custom, air-gapped version of the ClickHouse Cloud architecture within Anthropic's infrastructure.
ClickHouse solved the scale problem—but observability is never just about queries. Storage and pipeline efficiency soon emerge as the next bottleneck.
Storage Conundrum in Observability
With systems spouting millions of logs every second, storage was bound to be an issue. Moreover, the fact that these logs are often messy, which duplicates and no proper structure, makes this even more challenging.
So, processing these logs becomes a priority. Without this, the consequences are:
Storage Costs shoot through the roof. Imagine terabytes of logs being duplicated and taking space with zero value.
These same logs also impact the query performance and accuracy of the metrics.
The best way to process these logs is when they are received and before they are stored for further analysis. So, real-time Streaming ETL becomes essential. Fortunately for you, there is already a solution that can help you kickstart this relatively quickly: GlassFlow!
Realtime ETL with GlassFlow
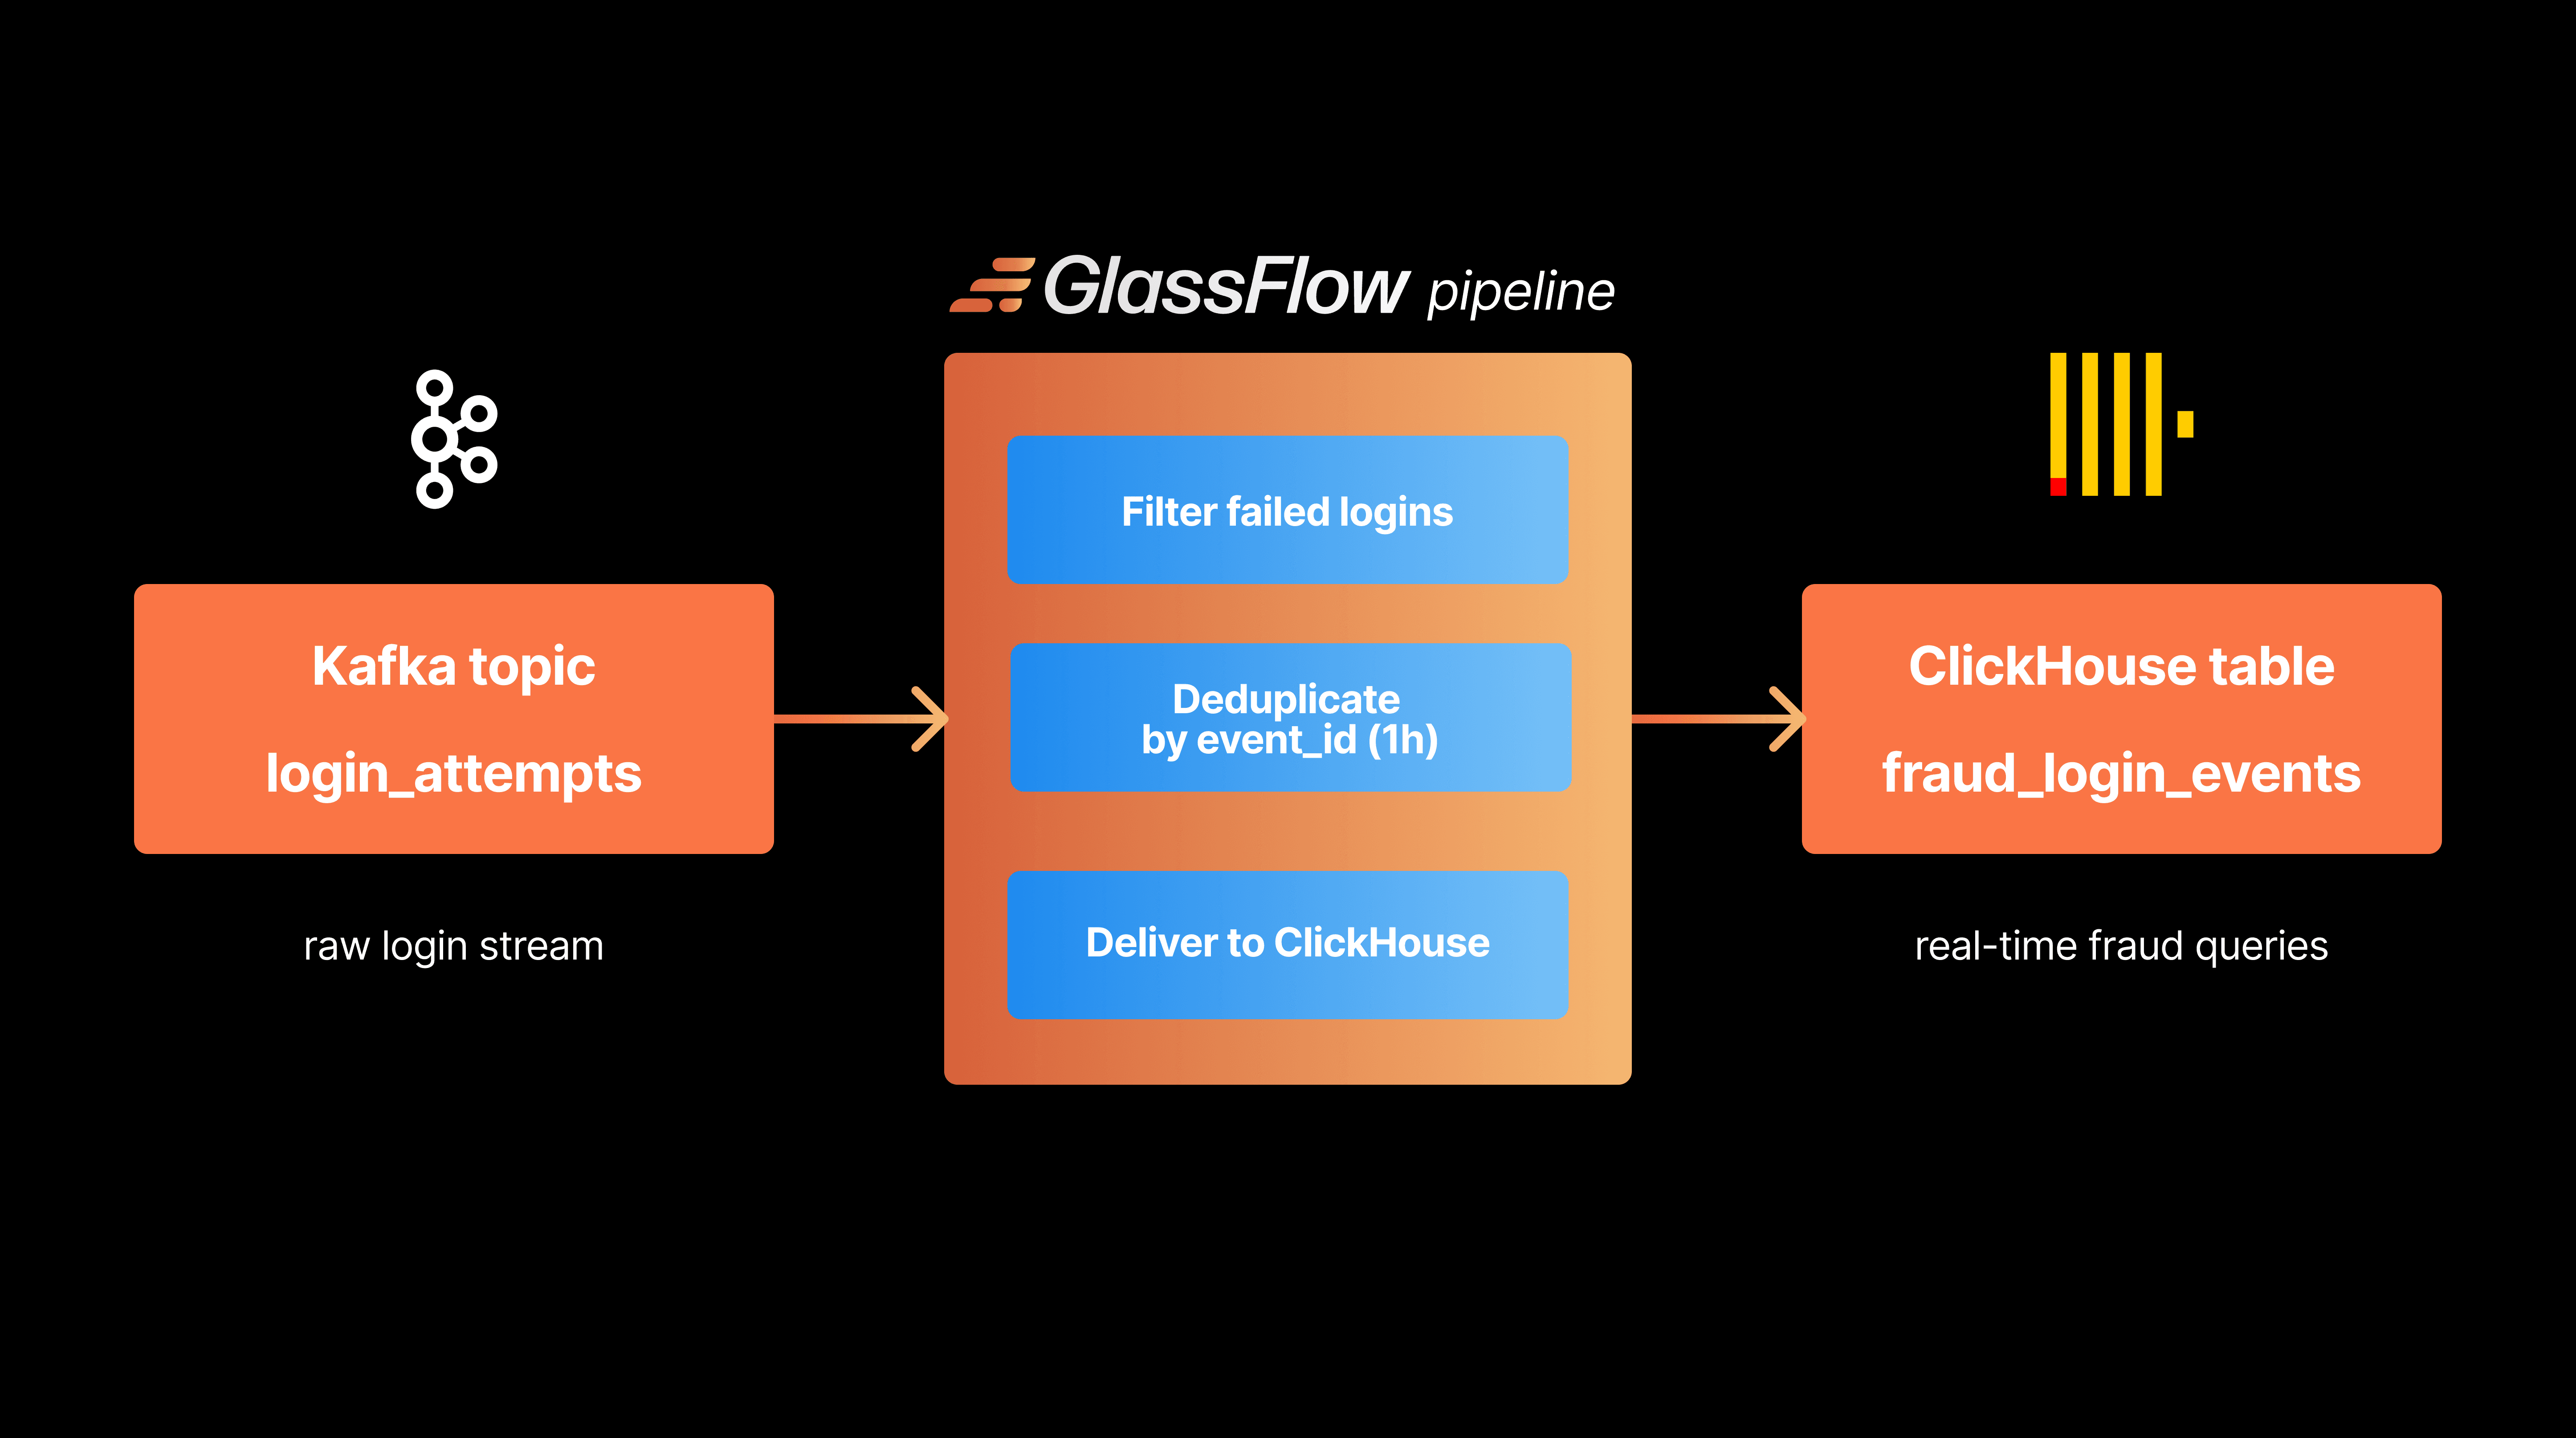
GlassFlow is a modern ETL / streaming transformation layer built to sit between Kafka (or other event sources) and ClickHouse. Its goal is to ensure observability pipelines remain lean, accurate, and performant by handling many of the tricky preprocessing tasks upstream. Here’s a summary of what it actually offers now, and how that fits into the AI logging use-case.
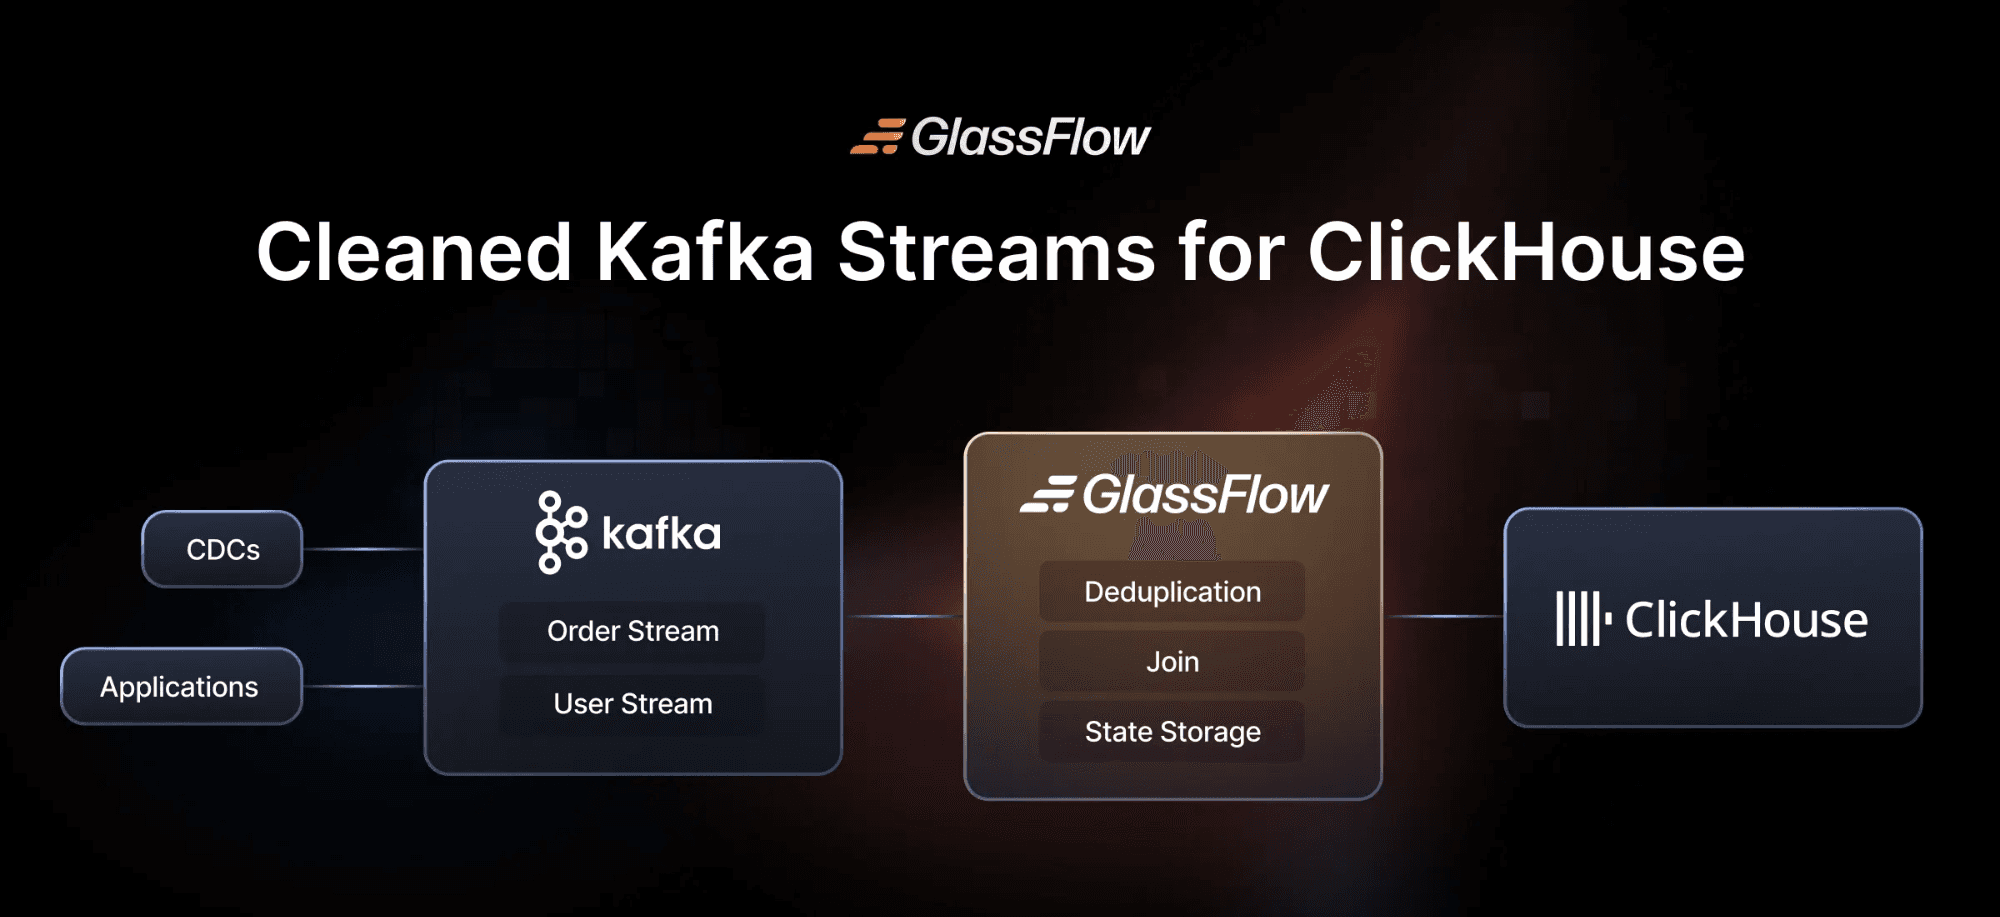
Where does GlassFlow fit in your solution
Here’s how GlassFlow works and why it’s such a compelling addition to an AI observability stack:
Feature | What It Does | Why It Matters for AI Logging / Observability |
|---|---|---|
Real-Time Deduplication | You can configure deduplication based on specified key(s) (e.g. | Reduces duplicate log entries caused by retries, multiple sources, or system glitches. Important for avoiding double counting, reducing unnecessary storage, and making metrics reliable. |
Temporal Stream Joins | Ability to join two Kafka streams in real time with configurable join key(s) and a time window (again, up to 7 days). The “secondary” stream can supply contextual or lookup data to enrich events in the primary log stream before ingestion. | Enables enrichment of logs (e.g. model version, user metadata, environment info) without having to perform expensive joins after data is in ClickHouse. Helps for filters, grouping, dashboards, etc. |
Built-in Kafka and ClickHouse connectors | GlassFlow offers native connectors for Kafka as source and ClickHouse as sink. It abstracts away boilerplate of consuming from Kafka, configuring fetch/poll, and writing to ClickHouse, handling sink mapping, batch sizes, etc. | Simplifies the ingestion pipeline, reduces DevOps & engineering work. Less room for mis-configuration, more predictable performance. |
Web UI & SDK for Pipeline Configuration | Pipelines can be created via a visual Web UI (wizard style) where you select topics, define deduplication or join operators, configure schemas, mapping of fields, and configure time windows. There is also a Python SDK for advanced / programmatic setup. | Makes it accessible: teams can start with minimal code, then grow toward more custom or automated pipelines. |
Performance & Latency | In load tests: For a high-volume deduplication use case, GlassFlow achieved sub-0.12ms added latency in one benchmark, handled millions of records per second (depending on setup) without data loss or crashes. | For AI logging pipelines, low latency is critical, especially when logs are being used in near-real-time alerting, monitoring, or adaptive systems. |
Fault Handling / Dead-Lettering | When transformations fail or data doesn’t conform to expected schema, GlassFlow supports routing problematic or invalid events to a dead letter queue (DLQ) for later inspection or reprocessing. | Ensures that bad data doesn’t silently corrupt your observability backbone, but also that you can recover or inspect what went wrong. |
What to do with this Data?
How can AI be used to get the most out of your Logs?
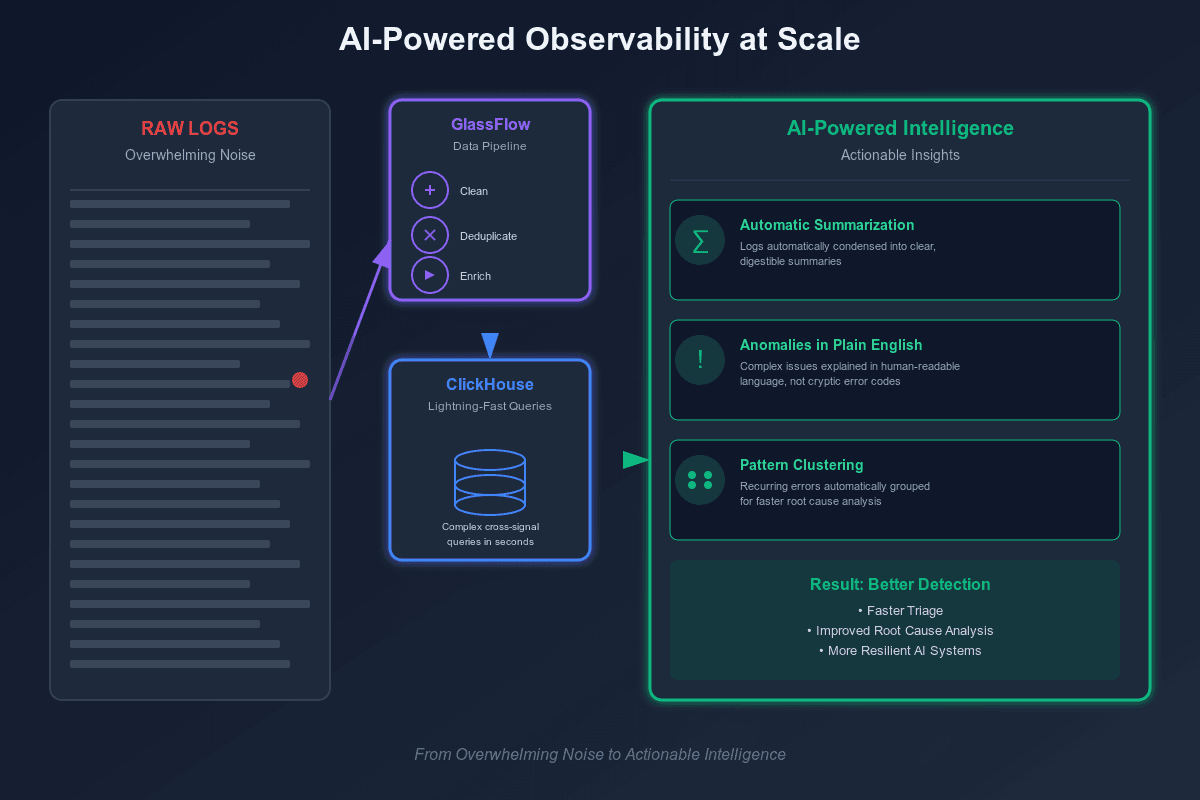
Collecting logs at AI scale is only half the battle—the real question is: what do you do with it? This is where AI itself comes into play. By applying LLMs to observability data, teams can move beyond dashboards and alerts to proactive insights. Imagine logs being automatically summarized, anomalies explained in plain English, and recurring error patterns clustered for faster root cause analysis. With AI in the loop, massive logging volumes transform from overwhelming noise into actionable intelligence.
ClickHouse makes this possible by giving you the raw speed to run complex, cross-signal queries in seconds, while GlassFlow ensures that only clean, deduplicated, and enriched events hit storage in the first place. Together, they let you **feed better data to AI models—**and better data means better detection, better triage, and ultimately, more resilient AI systems.
Conclusion
AI workloads are pushing observability into uncharted territory. Every prompt, token, and inference explodes into logs, traces, and metrics at volumes that traditional systems simply weren’t built to handle.
ClickHouse has emerged as the backbone for this new era: a columnar database that can ingest and query observability data at AI scale. But raw scale alone isn’t enough. Without smart upstream processing, clusters become bloated, storage costs spiral, and queries grind under the weight of messy, duplicate, or noisy logs.
That’s where GlassFlow fits in. By deduplicating, enriching, and transforming data before it reaches ClickHouse, GlassFlow keeps observability pipelines lean, cost-efficient, and performant—making AI-scale logging not only possible, but practical.
If you’re building AI observability pipelines today, now is the time to explore GlassFlow. Check out Glassflow and try it in your own Kafka-to-ClickHouse stack, and join the growing community of engineers shaping the future of real-time observability.
Did you like this article? Share it!
You might also like


Data transformations at TB scale for ClickHouse
Get query ready data, lower ClickHouse load, and reliable pipelines at enterprise scale.
