ljn
Tutorials
Build a complete observability pipeline from telemetry to insights.
Written by
Armend Avdijaj
-

Introduction
In today's world of distributed systems and microservices, understanding what's happening inside your applications has become critical. When a user reports a slow page load, or worse, when your revenue-generating API starts failing at 3 AM, you need answers fast. Traditional monitoring—checking if servers are up or down—isn't enough anymore.
Observability is the practice of instrumenting your systems to collect telemetry data (logs, metrics, and traces) that reveals not just what is broken, but why it's broken. It's the difference between knowing your checkout service is down versus understanding that it's down because a database connection pool is exhausted due to a retry storm caused by a downstream payment API timeout. This level of insight is what separates companies that can resolve incidents in minutes from those that struggle for hours.
However, building a robust observability pipeline is challenging. You need to collect billions of events, process them in real-time, store them efficiently for analysis, and present them in a way that helps teams debug issues quickly. This tutorial shows you how to build exactly that—a production-grade observability stack that handles the complete journey from data collection to visualization, with proper ETL pipeline management, data deduplication, and schema transformation built in.
What You'll Build
Welcome! 👋 In this hands-on tutorial, you'll build a complete observability stack from scratch. By the end, you'll have a running system that collects, processes, and visualizes logs, metrics, and traces—just like the systems powering modern cloud-native applications.
Imagine you're building the observability infrastructure for a growing startup. You need a system that can:
Collect telemetry data (logs, metrics, traces) from your applications
Process and store millions of events per hour
Provide a beautiful UI for your team to search and analyze data
Scale horizontally as your traffic grows
Here's what we're building together:

Figure 1. High-level architecture overview
The Stack:
🔭 OpenTelemetry Collector - Industry-standard telemetry collection
📨 Apache Kafka - Reliable message streaming
🔄 Glassflow - ETL pipeline orchestration with built-in deduplication and transformations
🗄️ ClickHouse - Lightning-fast columnar database
📊 HyperDX - Modern observability UI
Prerequisites
Before we start, make sure you have these tools installed:
kubectl - Kubernetes command-line tool (install guide)
helm (v3.x) - Kubernetes package manager (install guide)
kind - Kubernetes in Docker (install guide)
Docker - Container runtime (install guide)
System Requirements:
💻 Minimum: 4 CPU cores, 8GB RAM
🚀 Recommended: 6 CPU cores, 12GB RAM
💾 Storage: ~15GB free space
💡 Tip: If you're on a Mac or Windows machine, adjust Docker Desktop's resource limits to meet these requirements in Preferences → Resources.
Understanding the Architecture
Let's break down what each component does and why it's needed.
The Complete Data Flow
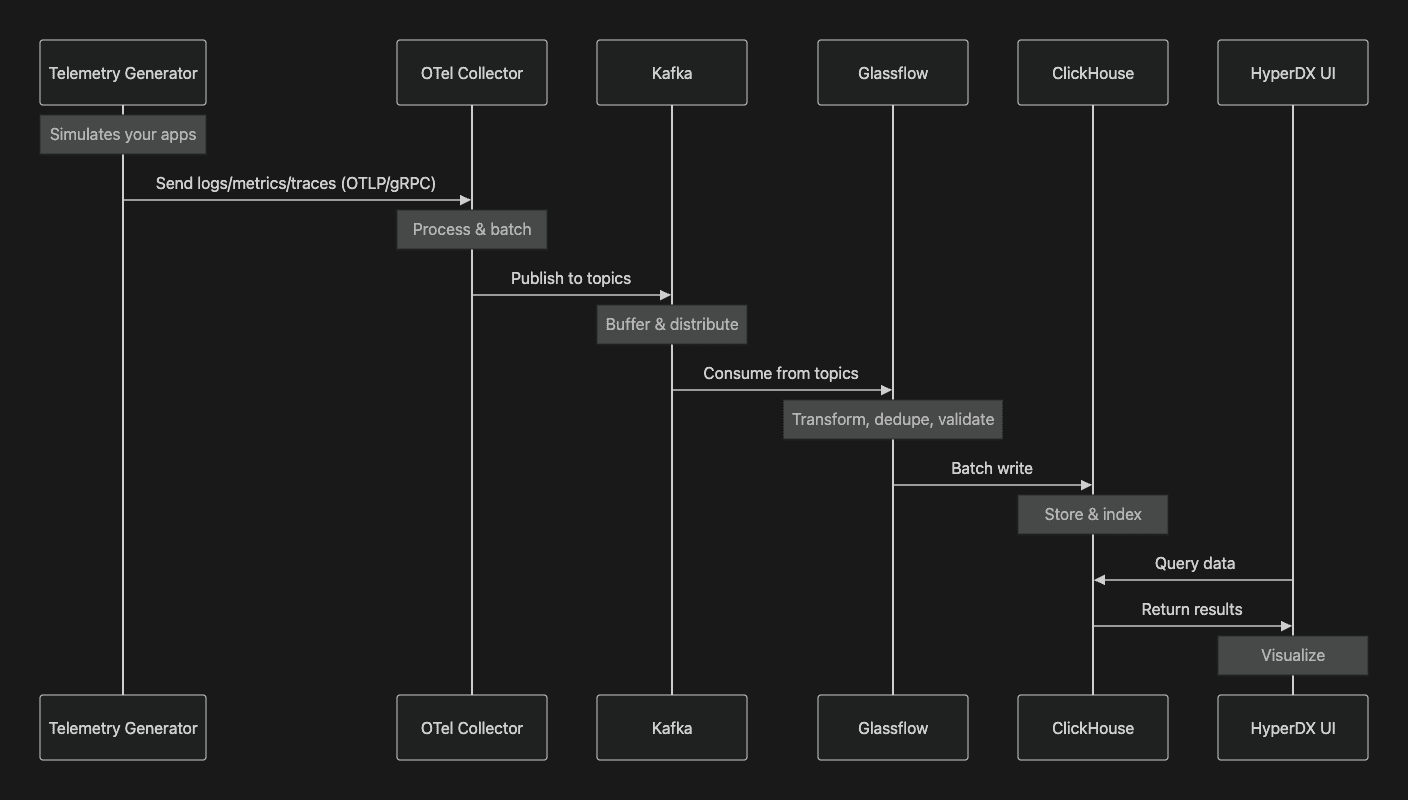
Figure 2. Sequence Diagram for Data Flow
Component Responsibilities
1. OpenTelemetry Collector (The Gateway)
Think of this as your reception desk. It:
Receives telemetry from applications via OTLP protocol (industry standard)
Performs initial processing (filtering, sampling, batching)
Routes data to appropriate destinations
Why we need it: Decouples your apps from your storage backend. Apps just need to speak OTLP.
2. Apache Kafka (The Message Highway)
A distributed messaging system that:
Buffers data between collection and storage
Handles traffic spikes without data loss
Enables multiple consumers to process the same data
Why we need it: Provides resilience and enables scaling components independently.
3. Glassflow (The Smart Pipeline)
This is where the magic happens! Glassflow:
Manages multiple ETL pipelines as declarative JSON configs
Deduplicates traces (no more duplicate spans!)
Transforms and validates data schemas
Handles retries and error recovery automatically
Provides backpressure management
Why we need it: Simplifies complex data pipeline operations that would otherwise require custom code.
4. ClickHouse (The Fast Database)
A columnar database optimized for:
Time-series data (perfect for telemetry)
High-speed inserts (millions of rows/second)
Fast analytical queries
Why we need it: Traditional databases can't handle the write throughput and query patterns of observability data.
5. HyperDX (The Beautiful UI)
A web application that:
Provides search and filtering
Visualizes traces as flame graphs
Creates dashboards and alerts
Why we need it: Raw database queries are powerful but not user-friendly.
Setting Up Your Environment
Let's get your local Kubernetes cluster running!
Step 1: Create Your Kubernetes Cluster
We'll use kind (Kubernetes in Docker) to create a local cluster:
What's happening:
Kind creates a Kubernetes cluster inside Docker containers
This takes about 1-2 minutes depending on the system you are running it in.
You'll see output showing nodes being created
Verify it worked:
You should see output showing your cluster is running at https://127.0.0.1:...
💡 What is kind? It's Kubernetes running in Docker containers. Each "node" is actually a Docker container, making it perfect for local development.
Step 2: Clone the Repository
If you haven't already, get the demo code:
Deploying the Stack
Now for the exciting part—let's deploy everything! To makes things even simpler, all you need to do this is: run one command!
The One-Command Deploy
We've automated the entire deployment process. Run:
What happens under the hood:
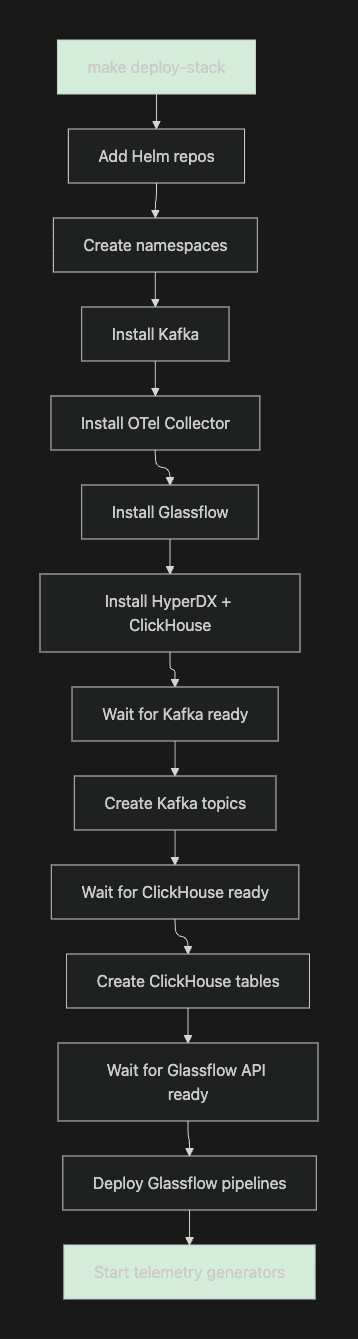
Figure 3. Deployment Workflow
What Gets Created
Once the deployment is complete, you should see the following output in your terminal.
Now, let’s Let's explore the namespaces we just created:
Running this will show You will see the following output:
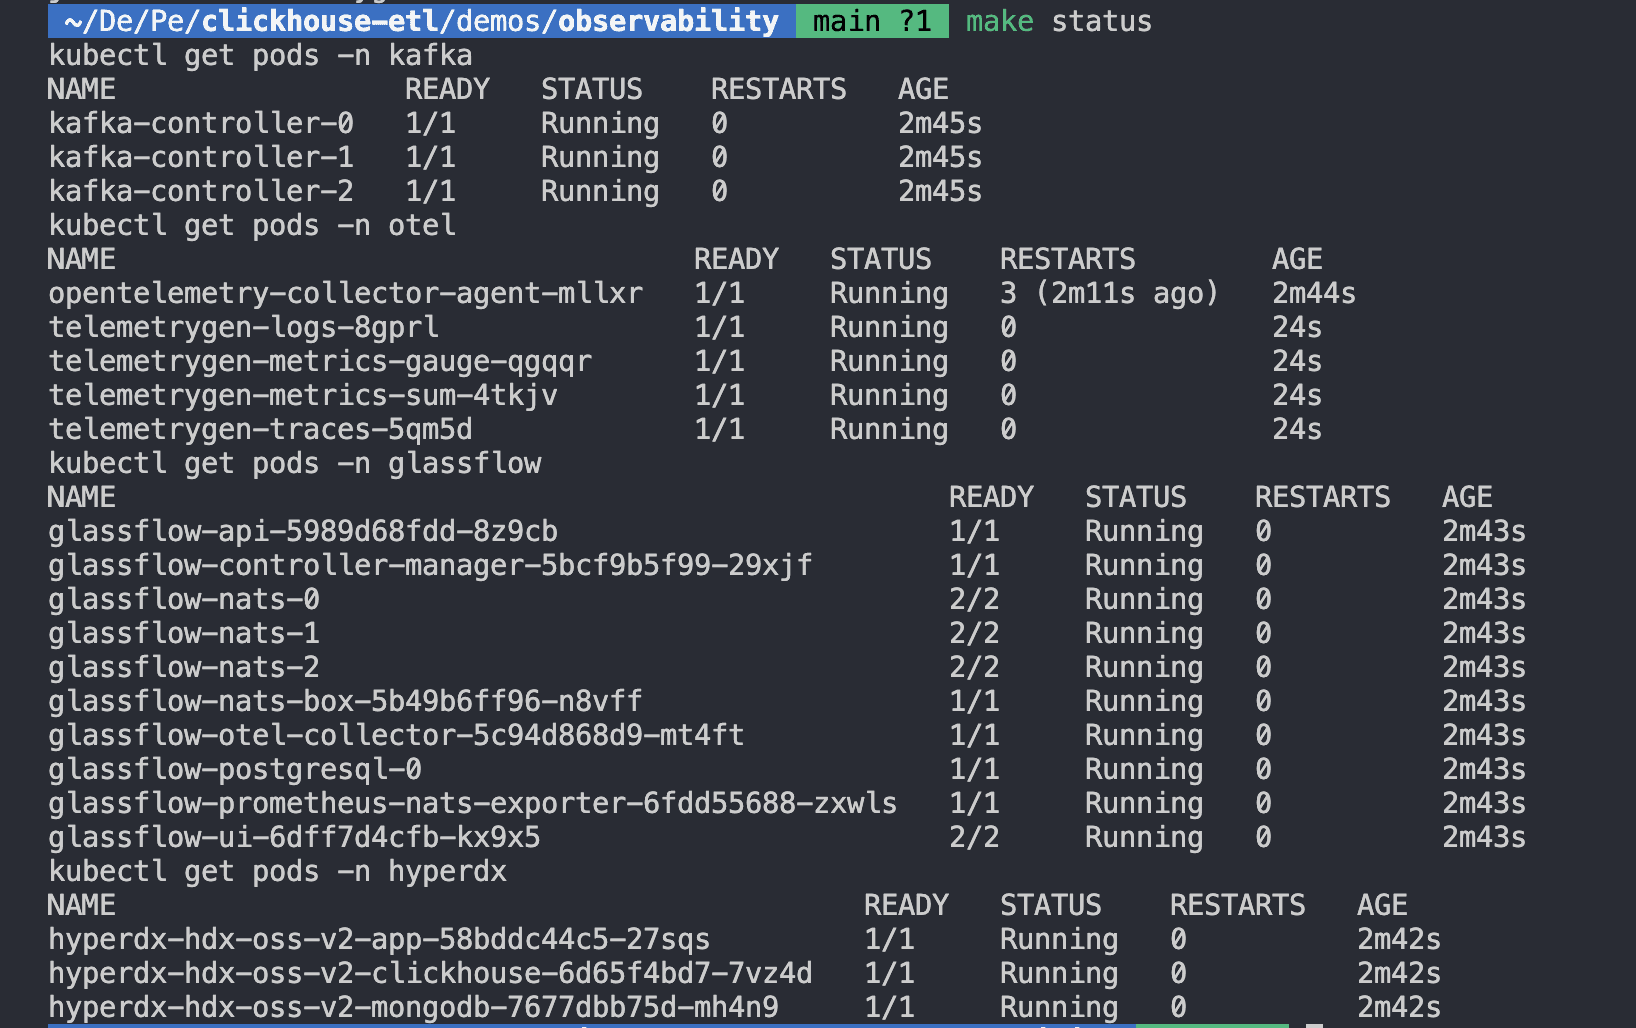
Figure 4. Deployment Status Check
All pods should show Running or Completed. If any are Pending or CrashLoopBackOff, see the Troubleshooting section.
Understanding the Data Flow
Now that everything is running, let's trace a single log entry through the entire pipeline.
Step-by-Step Journey of a Log Entry
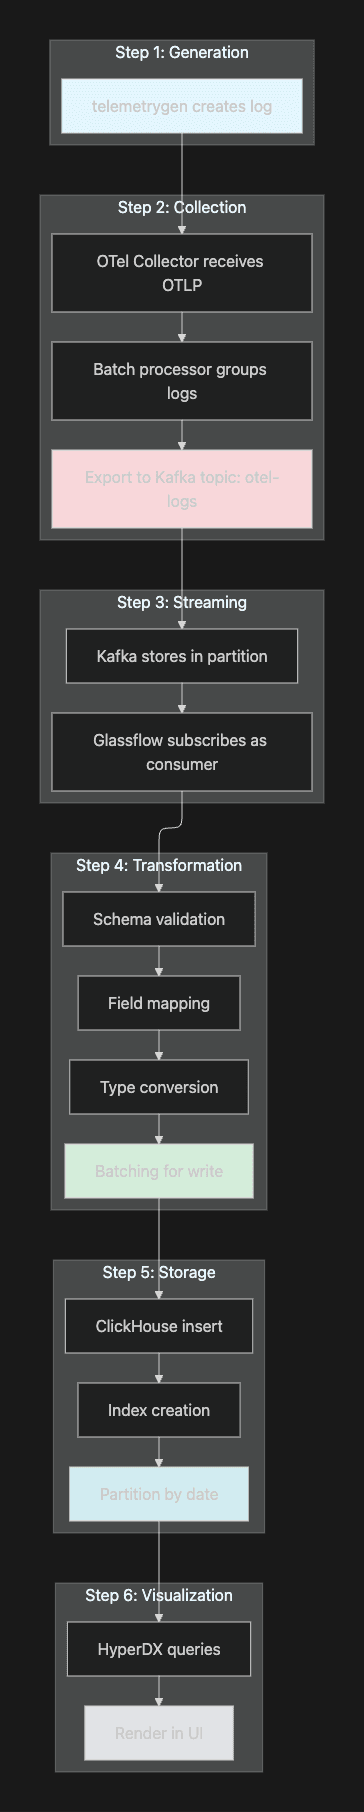
Figure 5. Journey of a Single Log Entry!
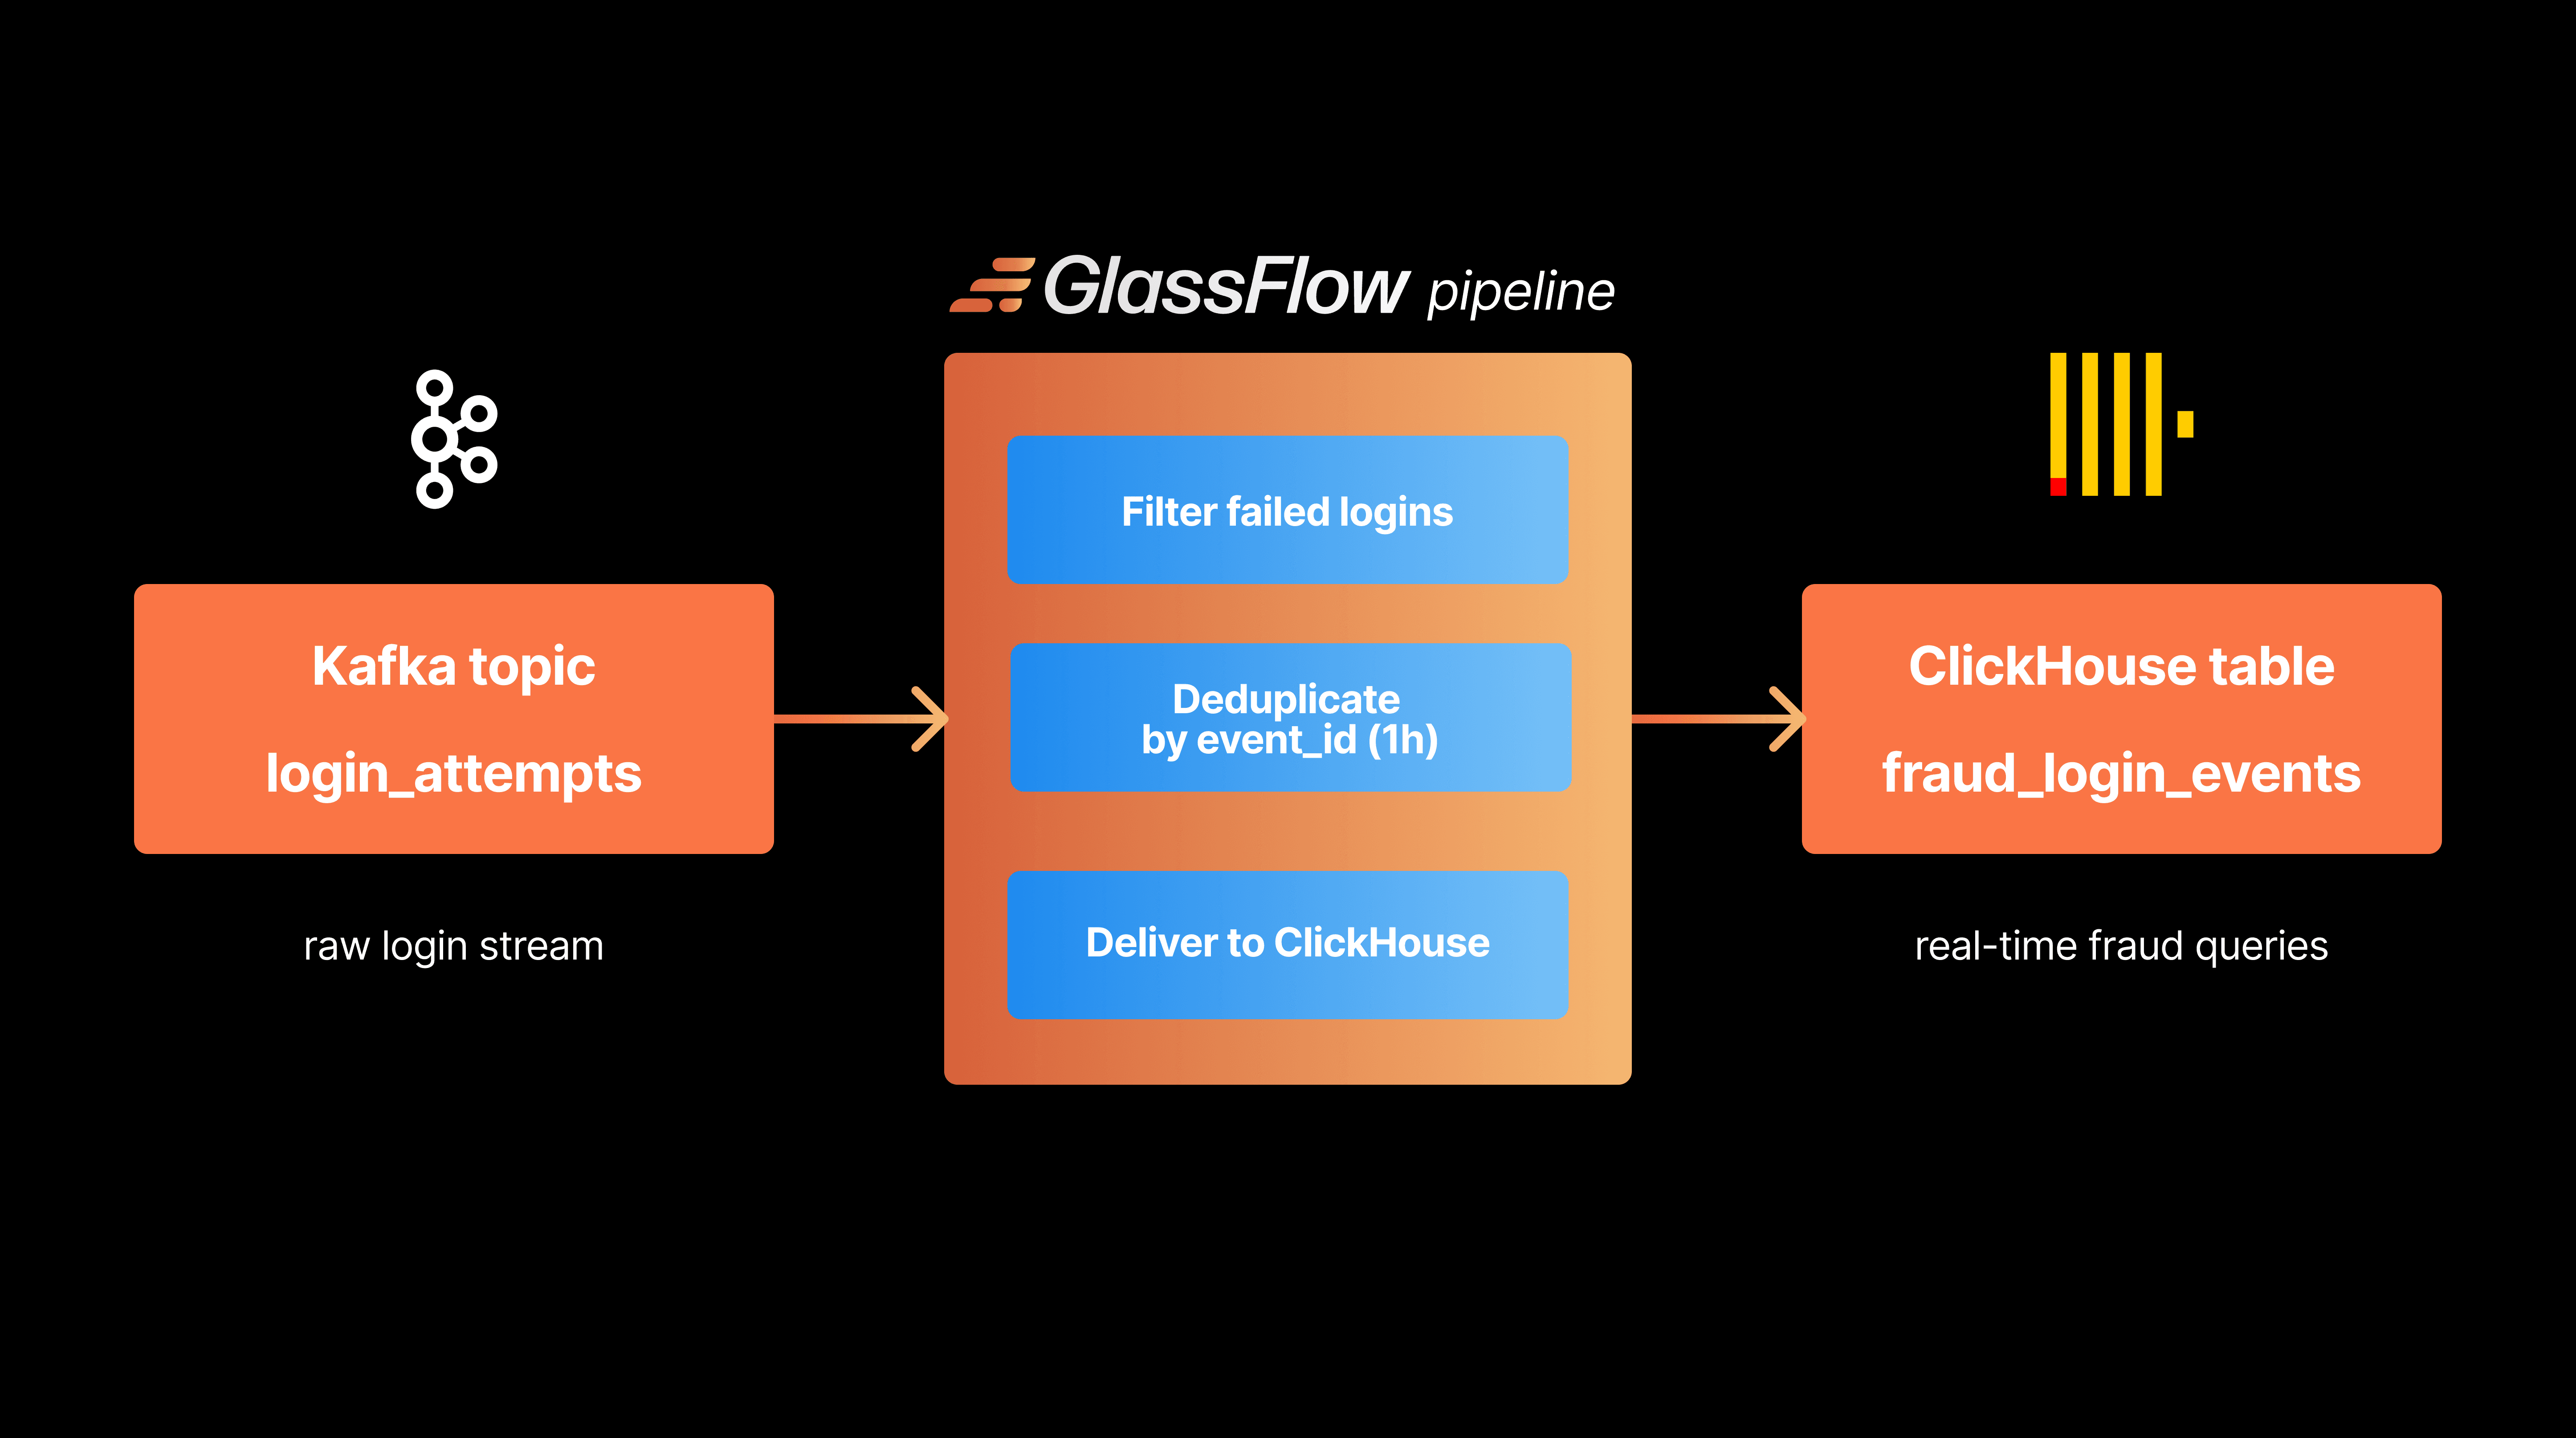
The Glassflow Pipeline Configuration
Let's look at how the logs pipeline is configured. The configuration is a simple declarative JSON that can be understood easily:
Key features of this are:
✅ Declarative - No code needed
✅ Schema mapping - Automatic type conversion
✅ Batching - Efficient writes (up to 1000 records or 30 seconds)
✅ Monitoring - Built-in metrics and health checks
Exploring Your Data
Let's actually see the data flowing through the system.
Access the HyperDX UI
Open a new terminal and run:
This creates a port-forward to HyperDX. Now open your browser to:
You should be able to see all the telemetry events coming into ClickHouse on the UI as shown below.
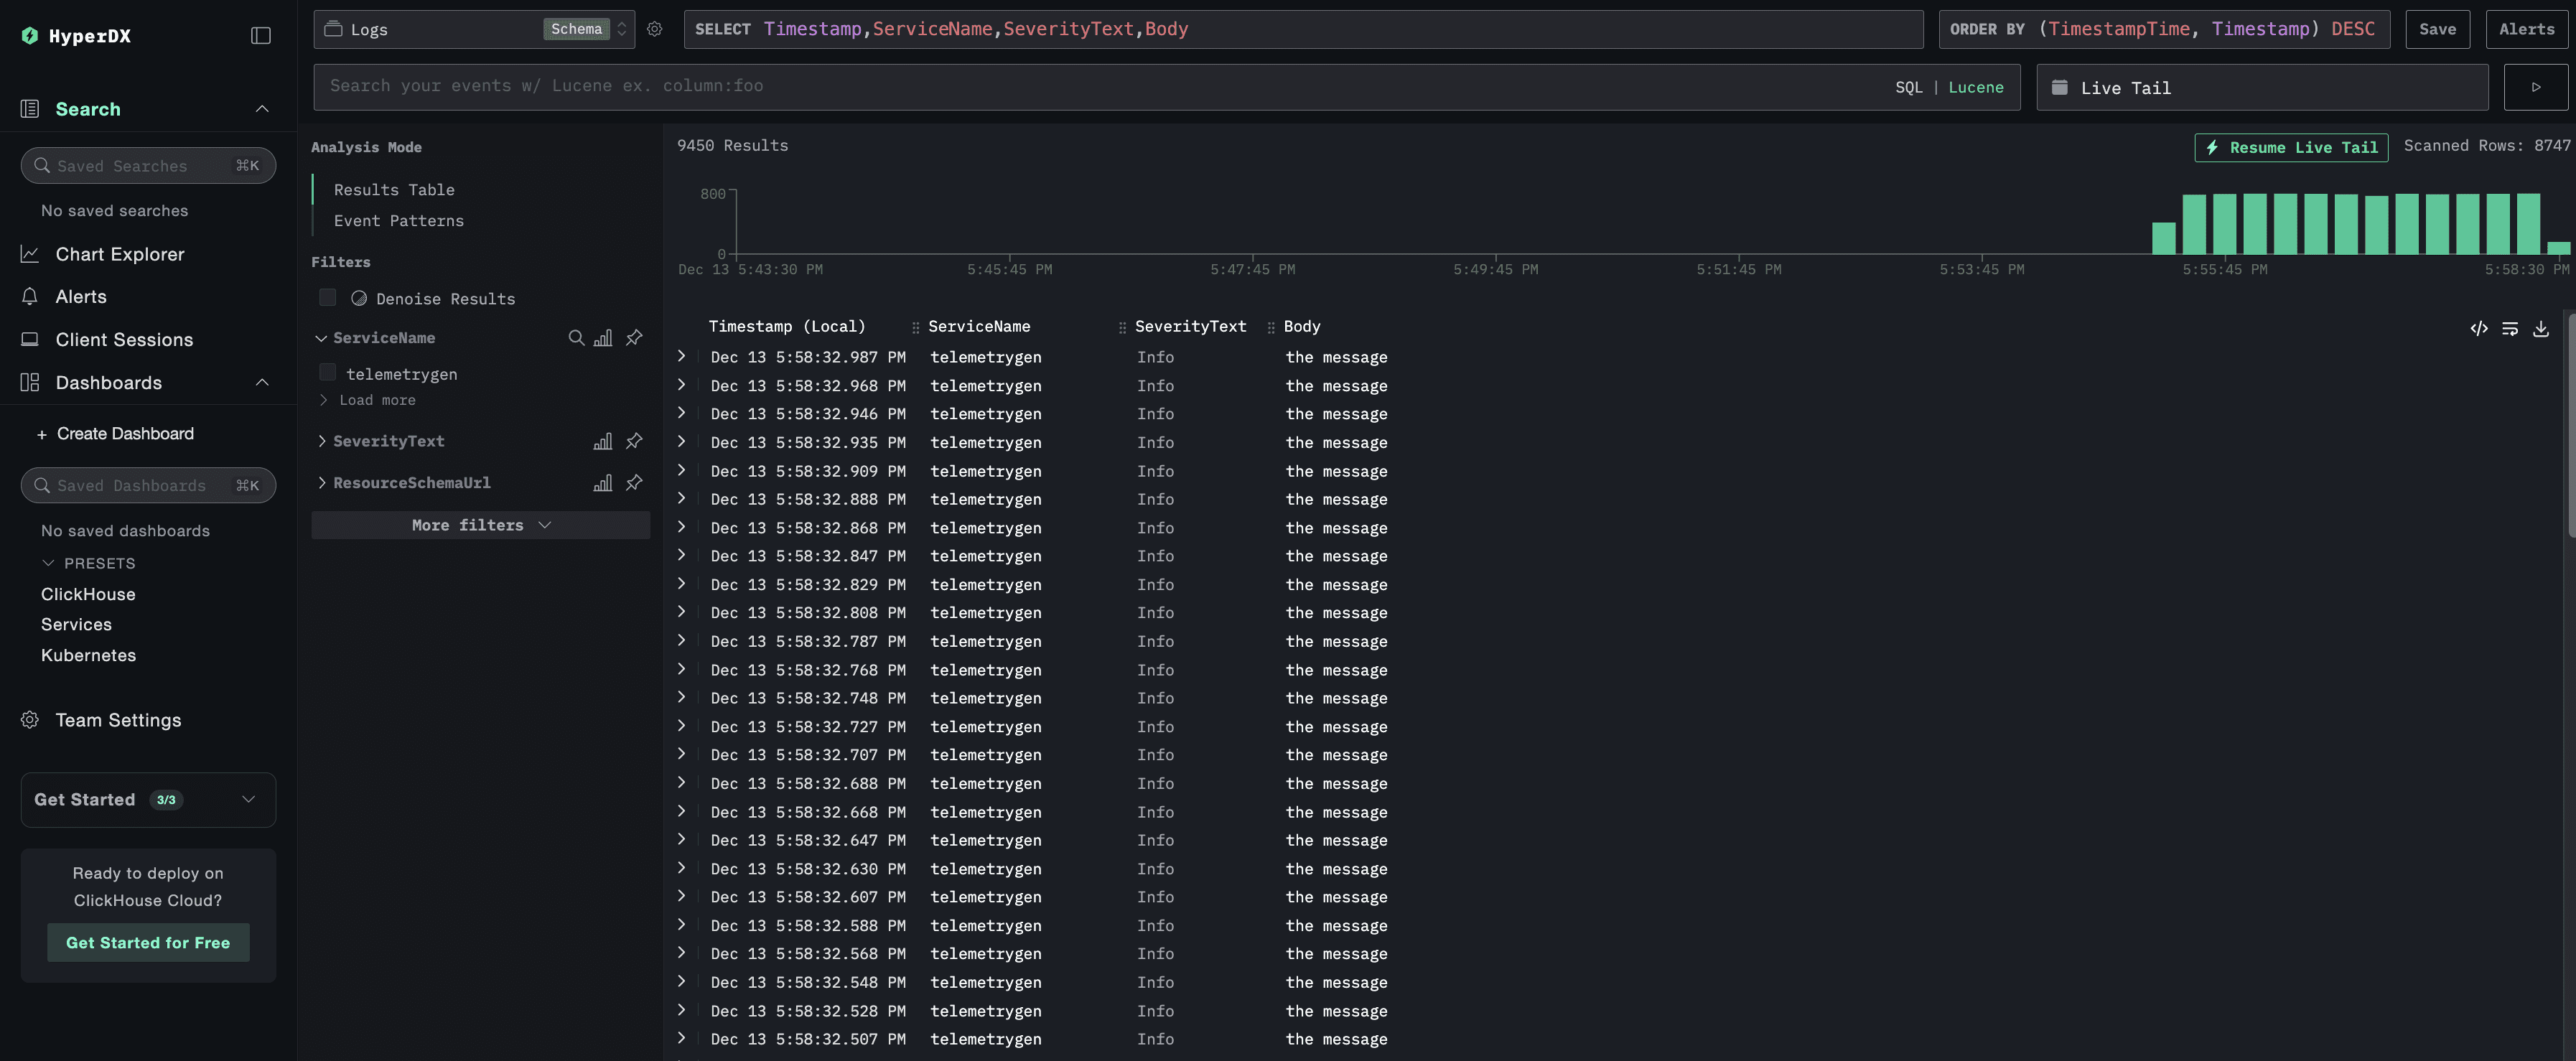
Figure 6. Checking your Logs on the UI!
Neat, right?
Access the Glassflow UI
Now, to see how Glassflow is doing with the pipelines, run the following command in another terminal window:
Then, Open your browser to:
Here, if you navigate to the Pipelines section, you will be able to see the 4 pipelines that have been created for this tutorial.
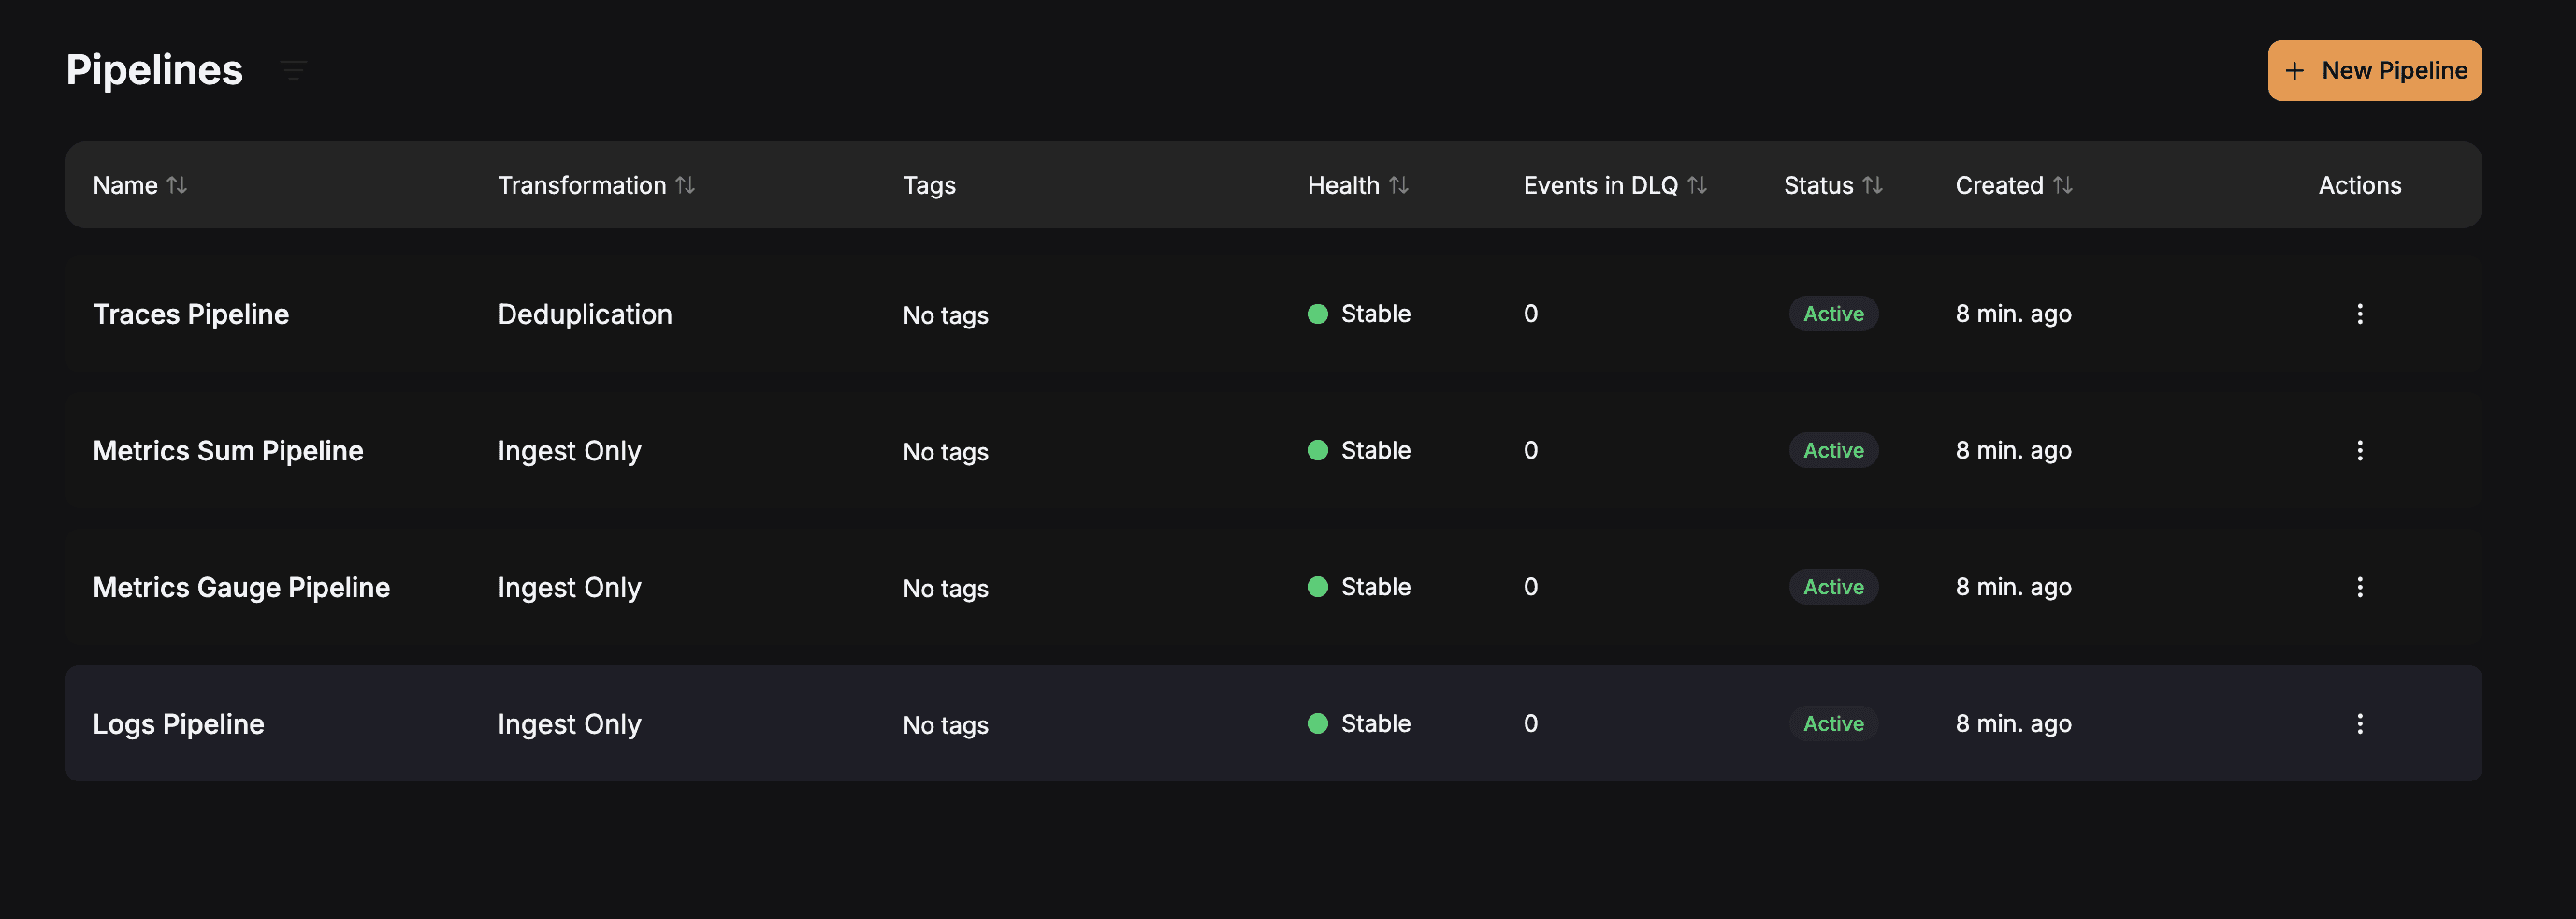
Figure 7. Checking the Active GlassFlow Pipelines
Let’s take a closer look at the Metrics Sum Pipeline by clicking on it. It will provide us with an intuitive interface to look at a lot of things like the number of entries in the destination table, details about the source topic, the schema mapping, etc.
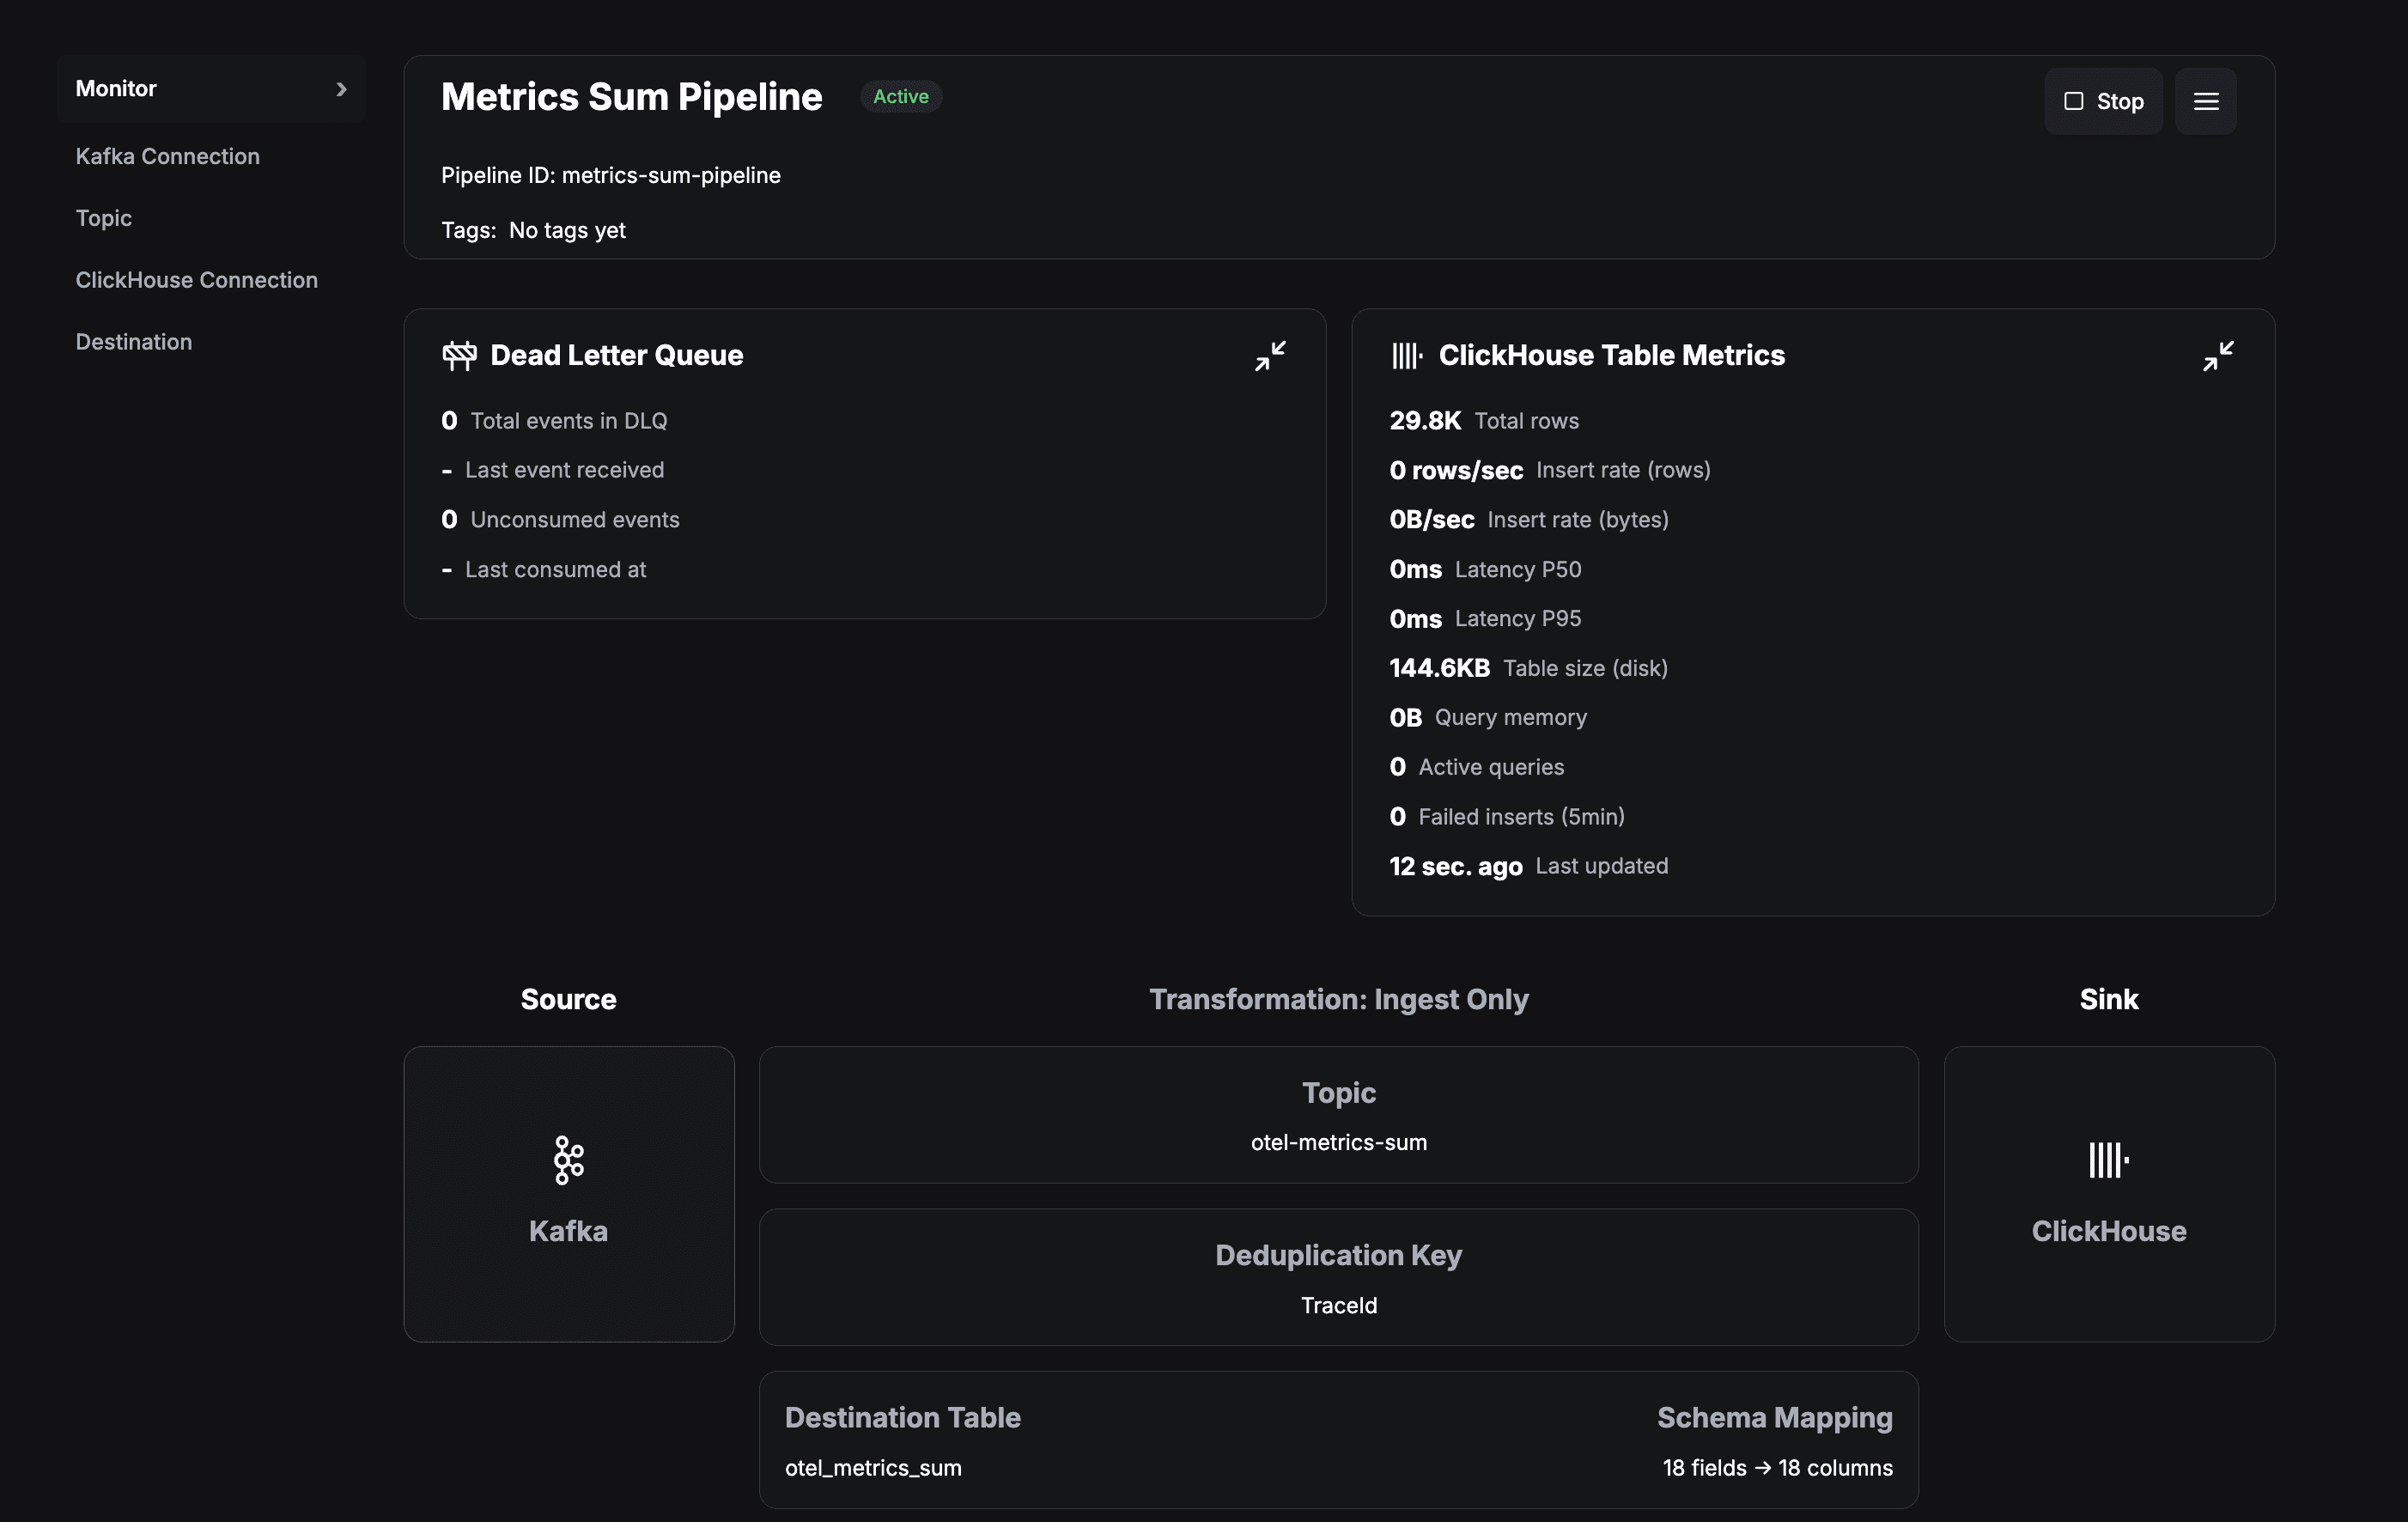
Figure 8. Pipeline Details at a Glance
Query ClickHouse Directly
Want to see the raw data? Let's query ClickHouse:
What you're seeing:
Thousands of events being written every minute
Real-time data from the telemetry generators
Properly structured and indexed data
How Glassflow Enhances the Pipeline
You might be wondering: "Why not just write from Kafka directly to ClickHouse?"
Great question! Let's explore what Glassflow provides.
1. Deduplication (Critical for Traces!)
Distributed tracing can generate duplicate spans. Glassflow handles this automatically:
How it works:
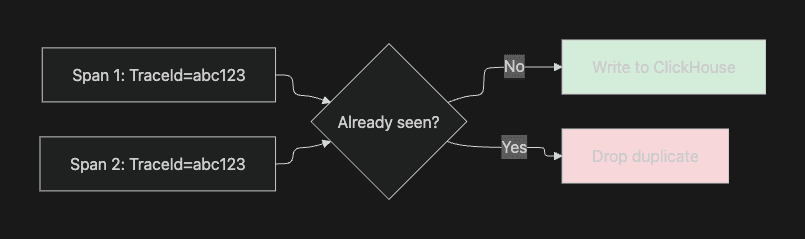
Figure 9. How Deduplication Works with GlassFlow?
Without this, you'd see duplicate traces in your UI! 🐛
2. Schema Management with Ease
As your application evolves, field types might change between Kafka topics and the actual ClickHouse Tables. Glassflow handles this gracefully with just some really simple configurations and also provides you an option to change it through the UI:
It looks something like this:
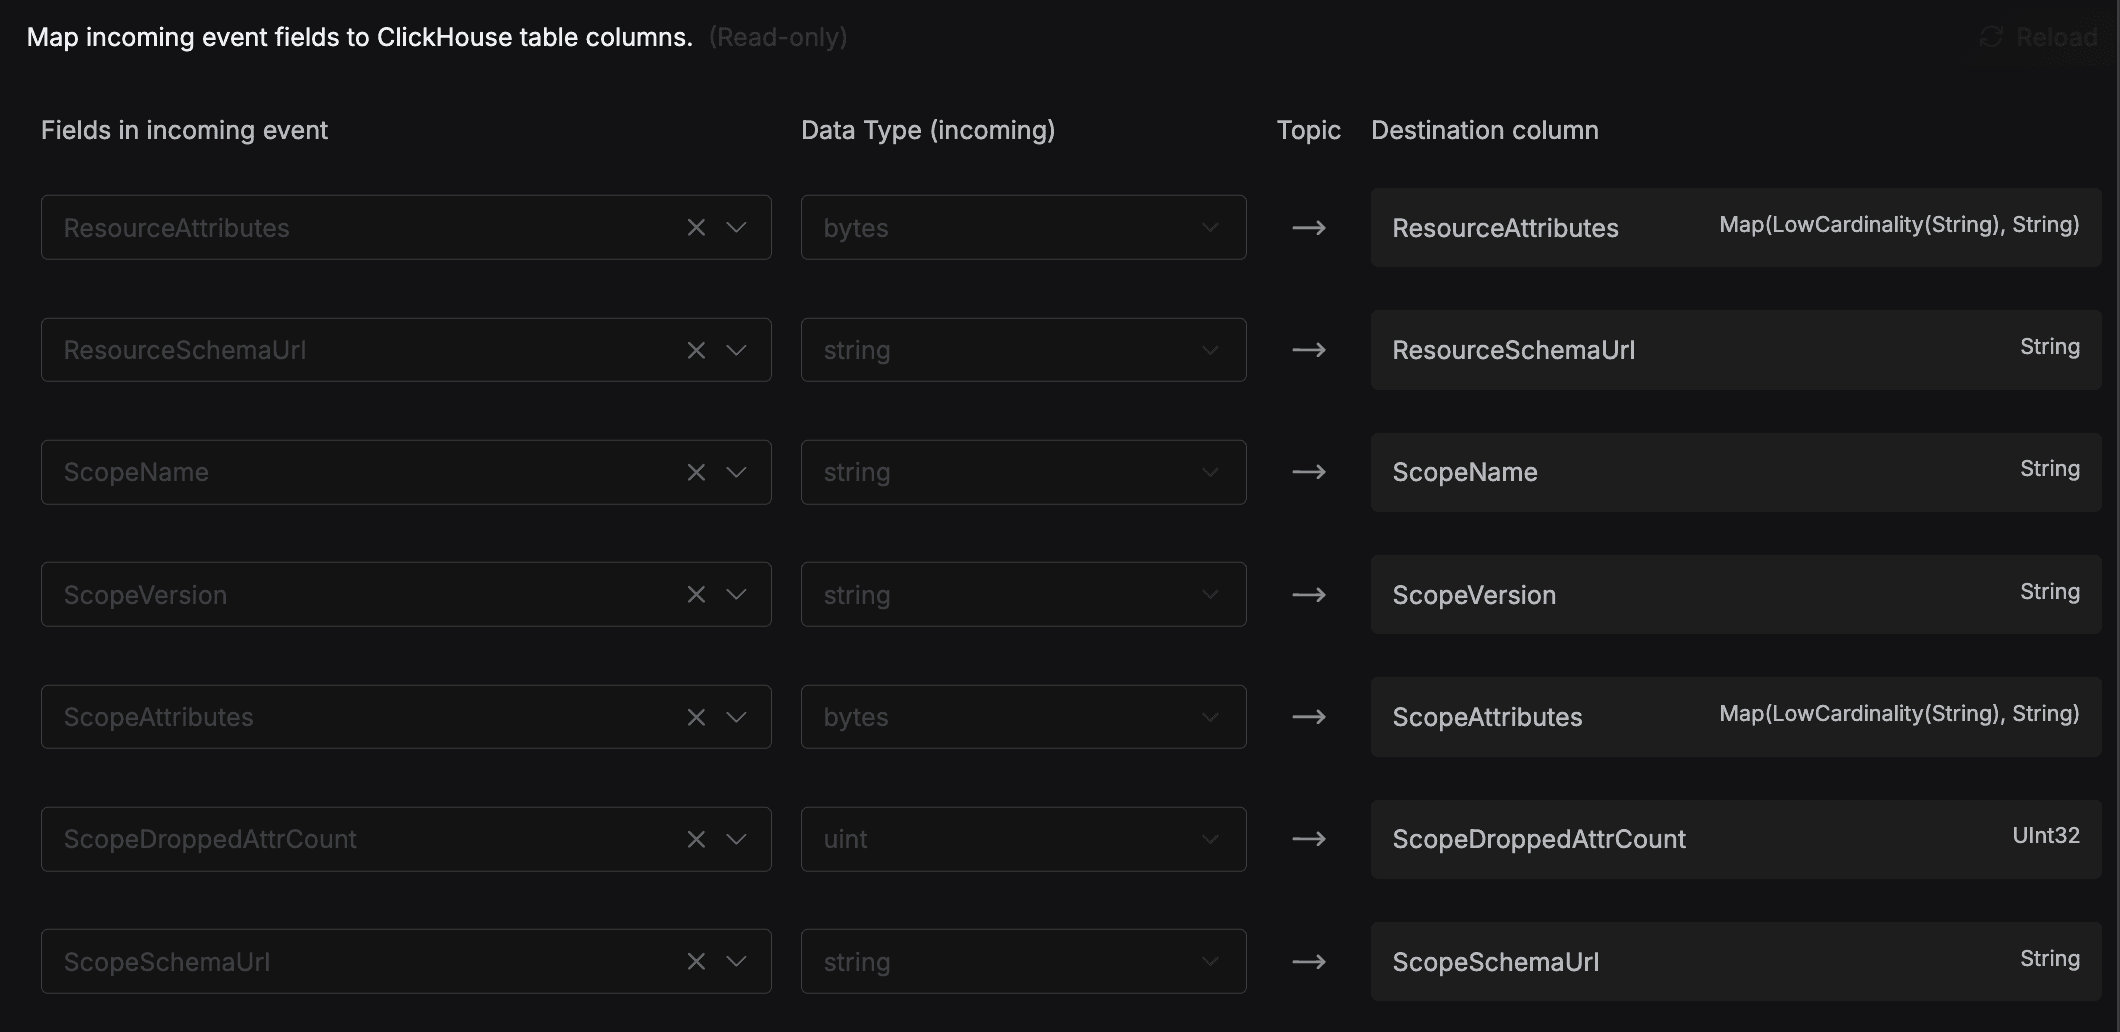
Figure 10. GlassFlow Schema Management (Configurable)
3. Batching & Backpressure
Glassflow optimizes writes to ClickHouse:
The batching strategy:
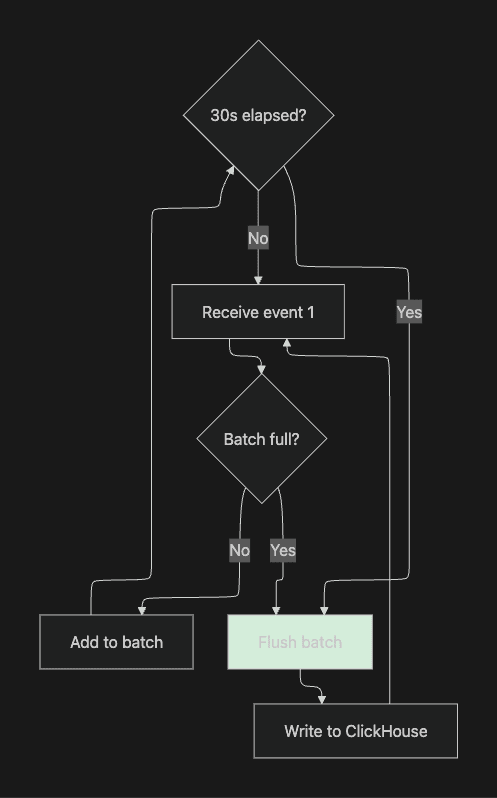
Figure 11. Efficient Writes to ClickHouse with Batching
This reduces database load while maintaining low latency.
4. Error Handling & Retries
Network issues? Schema errors? Glassflow has you covered:
Automatic retries with exponential backoff
Dead letter queue for problematic records
Detailed error logging
5. Monitoring & Observability
Glassflow exposes metrics about itself which can give you a better idea on how is it actually performing and provide you with some useful insights. These are the kind of metrics it tracks:
Events processed per second
Consumer lag
Error rates
Pipeline health status
To access these metrics, scrape Glassflow’s Prometheus-compatible
/metricsendpoint: {release-name}-otel-collector.{namespace}.svc.cluster.local:9090/metrics
These metrics can be visualized by connecting the endpoint to Prometheus and a dashboarding tool such as Grafana.
For more details, refer to the official documentation.
Troubleshooting
Running into issues? Here are some common problems that you might encounter and quick and easy solutions which will allow you to get up and running without any issues!
1. Problem: Pods Stuck in Pending
Symptom: kubectl get pods -A shows pods in Pending state
Diagnosis:
Common causes:
Insufficient resources - Increase Docker Desktop memory to 12GB
Storage issues - Check
kubectl get pvfor persistent volumes
Solution:
2. Problem: HyperDX Shows No Data
Symptom: UI loads but shows empty dashboards
Diagnosis:
Common causes:
Pipelines not deployed correctly
Telemetry generators not running
Solution:
3. Problem: Out of Memory Errors
Symptom: Pods getting OOMKilled
Diagnosis:
Solution:
Reduce telemetry generation rate. Edit the telemetry files:
Next Steps
Congratulations! 🎉 You've built a production-ready observability pipeline! Now, let’s explore how you can take this even further and integrate it into your existing workflow seemlessly.
Experiment Further
Add Custom Transformations
Edit pipeline JSON files in
glassflow-pipelines/Add field filtering or enrichment
Redeploy with
make deploy-pipelines
Scale the System
Update the
replicasvalue in your Glassflow pipeline configuration(see the pipeline JSON reference)
Ensure the Kafka topic consumed by the pipeline has at least the same number of partitions as replicas
Each pipeline ingestor replica will read from one or more partitions, allowing horizontal scaling through Kafka partitioning
3 pipeline replicas → Kafka topic should have ≥ 3 partitions
Monitor Resource Usage
Connect Your Real Application
Use the OpenTelemetry SDK in your app
Point to:
opentelemetry-collector.otel.svc.cluster.local:4317Remove telemetry generators
Learn More
Clean Up
When you're done experimenting:
Summary
You've learned how to:
✅ Deploy a complete observability stack on Kubernetes
✅ Understand OpenTelemetry data collection
✅ Use Kafka for reliable message streaming
✅ Configure Glassflow ETL pipelines declaratively
✅ Store telemetry in ClickHouse for fast queries
✅ Visualize data in a modern UI
The Key Takeaway
Glassflow eliminates the complexity of building custom ETL code for your observability pipeline. Instead of managing Kafka consumers, handling retries, and implementing deduplication logic, you define pipelines as simple JSON configurations.
This lets you focus on understanding your systems, not maintaining data pipelines.
Questions or Issues?
💬 Open an issue on GitHub
📧 Email: [email protected]
📚 Read the full guide for more technical details
Happy observing! 🔭
Did you like this article? Share it!
You might also like


Data transformations at TB scale for ClickHouse
Get query ready data, lower ClickHouse load, and reliable pipelines at enterprise scale.
