ljn
ClickHouse Learnings
A practical overview of the ClickHouse ecosystem and its key tools.
Written by
Armend Avdijaj
-

Introduction
ClickHouse started as a specialized tool for web analytics. Nowadays, however, it has transformed into the cornerstone of modern real-time data platforms. This is quite a significant shift in the database landscape in the last decade. As data volumes transition from gigabyte-scale exploration to petabyte-scale production environments, the realization that a high-performance engine alone is insufficient has become a foundational principle of data engineering. Modern production environments require a "village" of tools—a sophisticated orchestration of specialized utilities that manage the lifecycle of data from generation and local ingestion to streaming transformation, infrastructure management, and full-stack observability. The transition is marked by a definitive movement away from brittle, custom-built shell scripts toward professional-grade operators, embedded analytical engines, and OpenTelemetry-native monitoring platforms.
Historically, ClickHouse was operated as a standalone entity, requiring significant manual intervention for tasks such as schema migration, backup management, and log exploration. However, the current standard mandates a decoupled yet integrated architecture. This "Ecosystem Approach" recognizes that while ClickHouse excels at query execution and data compression, its utility is maximized when complemented by tools that handle the "heavy lifting" of data movement and infrastructure governance. The move toward specialized tools is driven by the need for exactly-once delivery in streaming, sub-second latency in full-stack debugging, and seamless scaling within Kubernetes environments.
Local Development & Embedded Ingestion
The entry point for any ClickHouse project often begins locally, and the ecosystem has evolved to provide tools that lower the barrier to entry while maintaining architectural parity with production environments. The distinction between a standalone server and in-process execution has become a critical choice for data engineers during the prototyping phase.
Ad-Hoc Ingestion and Querying with clickhouse-local
The clickhouse-local utility stands as the primary official tool for ad-hoc data processing. It is essentially a standalone executable that encapsulates the entire ClickHouse server logic but operates without a persistent background process or network interface. This architecture allows engineers to treat ClickHouse as a high-powered SQL-based alternative to traditional Unix utilities like grep or awk.
The utility excels in the "pre-pipeline" phase, where an engineer must inspect raw data files—whether stored in CSV, Parquet, or JSON—to determine the optimal schema and primary keys. Because clickhouse-local supports over 70 input formats and can query remote data directly via S3 table functions, it serves as the fastest mechanism for data inspection. The lack of a network hop eliminates serialization overhead, allowing for near-instant execution on local datasets.
Feature | clickhouse-local | ClickHouse Server |
|---|---|---|
Deployment Mode | Standalone Executable | Client/Server Service |
Network Overhead | None (In-process) | HTTP/TCP Latency |
Persistence | Ephemeral (unless | Persistent Storage |
Primary Interaction | CLI / Pipe | SQL Clients / APIs |
Use Case | Data transformation / Local files | Production workloads / Multi-user |
The chDB Embedded Engine and Python Integration
For scenarios where ClickHouse needs to be integrated directly into a programming environment, chDB has emerged as the leading embedded OLAP engine. Acquired by ClickHouse to unify the in-process experience, chDB runs the database engine inside the host process, typically a Python application or a Jupyter notebook.
The architectural highlight of chDB is its support for zero-copy data transfer. When working with analytical libraries like Pandas or Polars, chDB can pass data by reference through memory views rather than serializing data into an intermediate format. This eliminates the massive overhead often seen when moving data between a database and a dataframe. The mathematical efficiency of this approach is particularly evident in large-scale aggregations where the memory footprint is reduced by avoiding redundant copies. If $M$ is the memory required for a dataset, a traditional database connection requires $2M$ or more during the serialization/deserialization phase, whereas chDB approaches $1M$.
However, the embedded model introduces specific resource management challenges. Because chDB shares the memory space of its host process, a query that consumes excessive RAM will cause the entire application to terminate with an out-of-memory (OOM) error. Unlike the ClickHouse server, which can implement sophisticated query quotas and spill large sorts to disk, chDB is bound by the limits of the single process it inhabits.
Synthetic Data Generation with Mockaroo
Before any real-time traffic hits a production cluster, the schema must be validated for compression efficiency and query performance. Mockaroo serves as the precursor to ingestion by allowing engineers to generate realistic datasets that mimic production distributions.
ClickHouse's legendary speed is fundamentally tied to its ability to compress data. This compression is achieved through columnar storage and specialized codecs that exploit contiguous patterns in sorted data. Mockaroo allows for the testing of these patterns by providing:
Correlated Fields: Generating data where "City" and "Country" are logically linked, or "First Name" and "Gender" match, allows engineers to test how well ClickHouse's
DeltaorDoubleDeltacodecs perform on realistic, sorted streams.Cardinality Simulation: By adjusting the distribution of values, engineers can determine whether a column should be typed as
LowCardinality(String)or a standardString.Formula-Based Logic: Using Ruby-based formulas,
Mockaroocan create dependent fields that test the efficiency of complexORDER BYkeys.
A common workflow involves using Mockaroo to generate a CSV or SQL file, which is then ingested via clickhouse-local to measure the compressed_size vs uncompressed_size of each column. This "schema hardening" phase ensures that storage costs are minimized and I/O throughput is maximized before the first production byte is stored.
Streaming, Transformation & Data Processing
Managing data in motion is perhaps the most complex aspect of the ClickHouse ecosystem. While ClickHouse provides native integration for Kafka, the 2025 standard increasingly favors a decoupled transformation layer to prevent "messy data" from entering the warehouse and to reduce the computational burden on the database cluster.
GlassFlow: The Python-Native Processing Layer
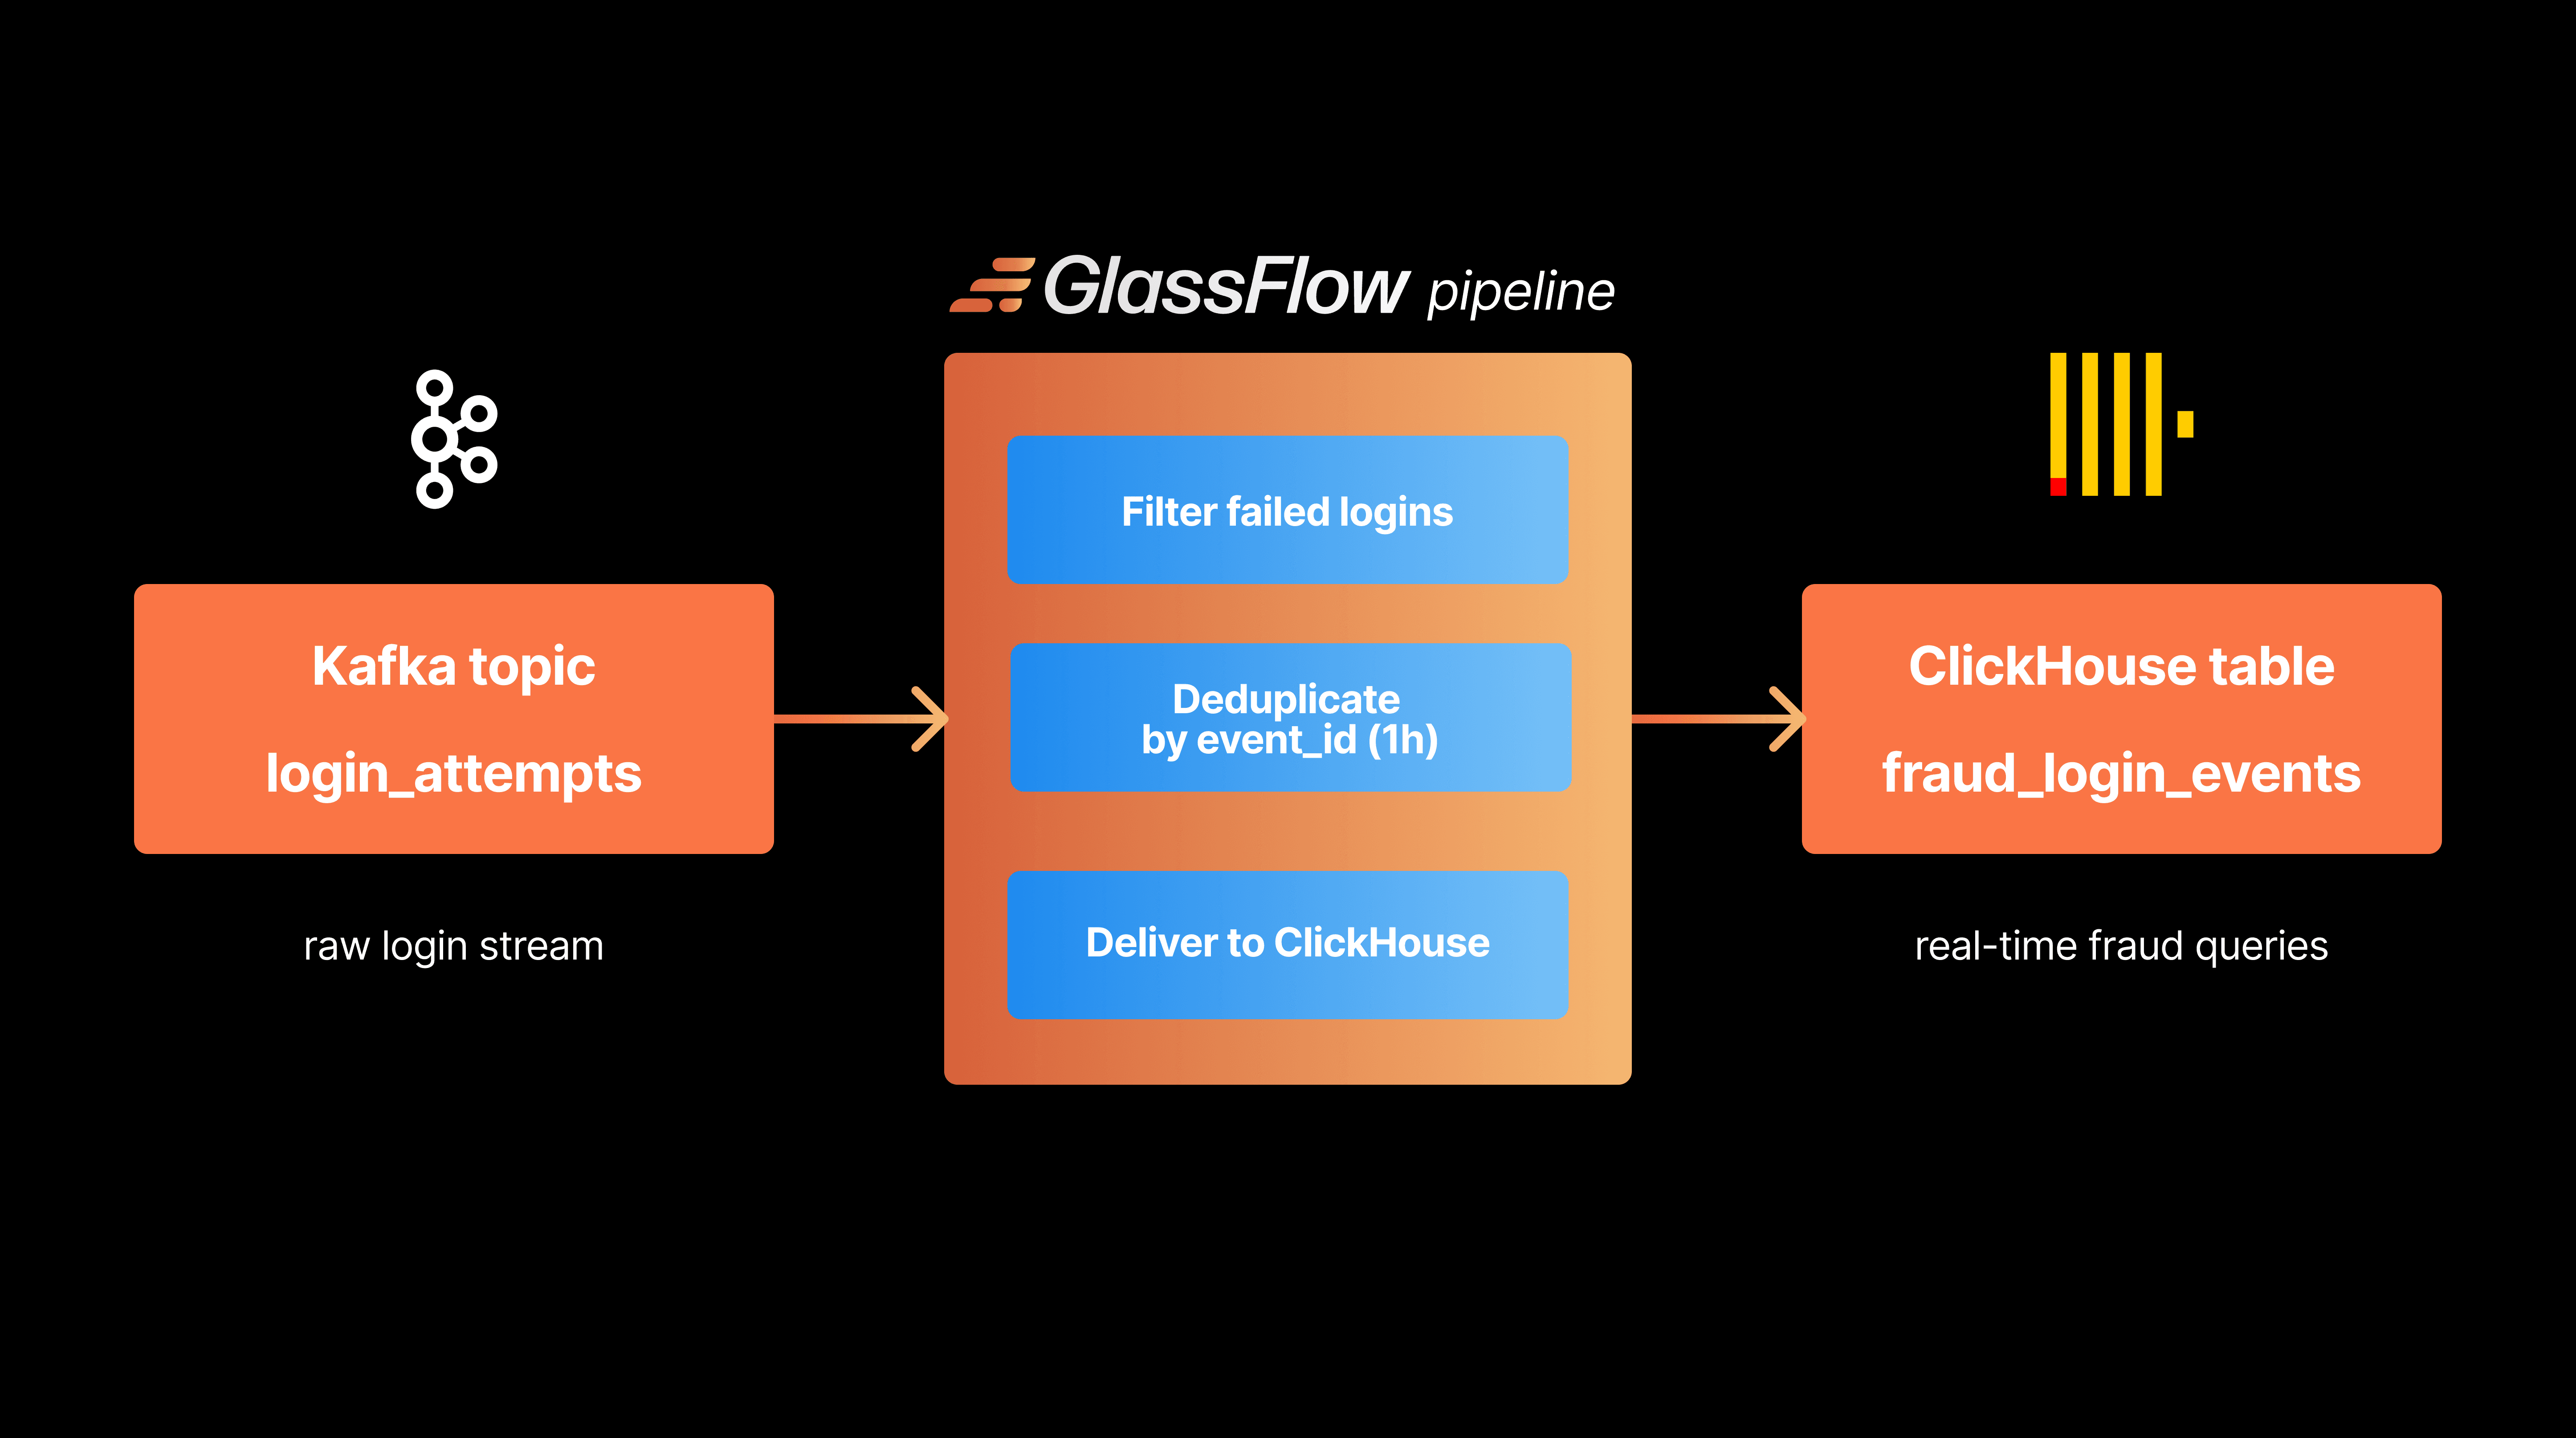
GlassFlow has positioned itself as the specialized streaming ETL tool for Kafka-to-ClickHouse pipelines. Unlike generic ETL tools, GlassFlow is built with a deep understanding of ClickHouse's architectural requirements, such as the need for large, batched inserts and the high cost of background merges.
Operational Problem | ClickHouse Native Solution | GlassFlow Solution |
|---|---|---|
Deduplication |
| Stateful In-Memory (Real-time) |
Joins | Join Engine / Sub-queries | Temporal Joins (Pre-ingest) |
Latency | Dependent on Merge cycle | Typical < 12ms Transformation Latency |
Late Data | Manual partition management | 7-day state store for re-ordering |
The primary insight provided by GlassFlow is the reduction of load on the ClickHouse core. In ClickHouse, deduplication typically relies on the ReplacingMergeTree engine, which removes duplicates during the background merge process. This means that duplicates may still appear in query results unless the FINAL modifier is used—a modifier that significantly degrades performance. By performing deduplication in the streaming layer before the data is even written to disk, GlassFlow allows the database to use the more efficient standard MergeTree engine, thereby improving query concurrency and reducing storage churn.
Furthermore, GlassFlow's ability to handle temporal joins in the stream allows engineers to enrich data before it hits the warehouse. This is critical for high-cardinality data where joins at query time become prohibitively expensive. The stateful processing layer can maintain context for up to 7 days, ensuring that even late-arriving events are correctly joined and deduplicated.
Operation, Backups, and Infrastructure Management
Running ClickHouse in production, particularly within Kubernetes, requires a level of operational governance that transcends simple container management. The Altinity Kubernetes Operator has become the industry standard for managing these complex stateful workloads.
Orchestration with the Altinity Kubernetes Operator
The Altinity Operator automates the hard parts of ClickHouse administration: scaling, version upgrades, and high availability. It utilizes the operator design pattern to map a declarative YAML manifest—the ClickHouseInstallation (CHI)—to the necessary Kubernetes resources like StatefulSets and Services.
A significant challenge in managing ClickHouse on Kubernetes is the handling of Persistent Volume Claims (PVCs) during scaling operations. The Altinity Operator provides a "Storage Management" feature that allows for volume expansion without recreating the underlying StatefulSet, provided the CSI driver supports it. This is a vital capability for 2025 production environments where data growth often outpaces the initial disk allocation.
Furthermore, the operator manages the "rolling procedure" for upgrades. Because ClickHouse clusters are often distributed and replicated, upgrading a version involves a delicate sequence of taking nodes offline, ensuring replication is caught up, and restarting services without losing data visibility. The operator parallelizes these tasks where possible to minimize the maintenance window while maintaining the integrity of the distributed system.
The Migration to ClickHouse Keeper
One of the most profound shifts in ClickHouse infrastructure management is the movement from Apache ZooKeeper to ClickHouse Keeper. ZooKeeper, being Java-based, often introduces operational overhead through JVM garbage collection pauses and a 1MB limit on node data size. ClickHouse Keeper, implemented in C++, is a lightweight coordination service that is integrated directly into the ClickHouse ecosystem.
Feature | Apache ZooKeeper | ClickHouse Keeper |
|---|---|---|
Language | Java (JVM) | C++ (Native) |
Resource Usage | High (CPU/Memory) | Low (Optimized) |
Packet Limit | 1MB Default | Configurable / Higher |
Operational Ease | High (Requires ZK expertise) | Low (Same config style as CH) |
The Altinity Operator facilitates this migration by providing a ClickHouseKeeperInstallation resource. For existing clusters, the migration path involves using a converter utility to transform ZooKeeper logs and snapshots into Keeper-compatible formats. This transition is essential for 2025 standards to avoid the "ZXID overflow" problem and the performance bottlenecks inherent in Java-based coordination services.
Backup Governance and Object Storage
Backups in ClickHouse are no longer just about copying data; they are about managing cost and restoration speed. The ecosystem primarily relies on the clickhouse-backup tool, which can be integrated with the Altinity Operator via sidecar containers or CronJobs.
The standard approach involves backing up to S3 or other-compatible object storage. This allows for long-term retention at a fraction of the cost of block storage. The Altinity Cloud management interface, for instance, allows engineers to define backup schedules and select preferred replicas for backup tasks, ensuring that the primary query-serving nodes are not impacted during the backup cycle. The integration with Kubernetes Secrets ensures that the credentials for these S3 buckets are handled securely, a requirement for any enterprise-grade deployment.
Observability & Visualization
As ClickHouse becomes the backend for observability data itself, the tools used to monitor and visualize it have become more sophisticated. The 2025 standard moves away from fragmented dashboards toward unified, full-stack observability platforms.
HyperDX: Unified Full-Stack Observability
HyperDX represents the pinnacle of the "ClickStack" philosophy—using ClickHouse to monitor ClickHouse and the applications that run on it. It is an open-source, developer-friendly platform that unifies logs, traces, metrics, and even session replays into a single interface.
The technical advantage of HyperDX lies in its "correlation-first" design. In traditional stacks, an engineer might identify an error in Grafana, search for logs in Kibana, and then look for a trace in Jaeger. This "swivel-chair analysis" is slow and error-prone. HyperDX leverages ClickHouse's ability to store logs and traces in the same high-performance columnar format, allowing for native SQL joins between these different telemetry types. This results in sub-second query performance even on petabytes of high-cardinality data, a feat that is often impossible with Lucene-based search engines like Elasticsearch.
Specialized Log Exploration with Telescope
While HyperDX provides a full-stack experience, Telescope is a specialized tool designed to turn ClickHouse into a lightweight, high-performance log management backend. It offers a web-based UI that simplifies log exploration without requiring the user to write raw SQL for every query.
Telescope's innovation is its "FlyQL" query abstraction layer. This allows users to perform fast, structured filtering using a simplified syntax while still benefiting from ClickHouse's underlying execution speed. For teams moving away from expensive ELK or Splunk installations, Telescope provides a familiar log-viewing experience with the cost efficiency of ClickHouse's columnar compression.
SQL Interfaces and Management: Tabix and CH-UI
For the database administrator or data engineer who needs to dive deep into query performance, the ecosystem provides several specialized UIs:
Tabix: This browser-based editor is the tool of choice for query tuning. It provides visual explain plans, allowing engineers to see exactly how ClickHouse is scanning parts and where bottlenecks occur. It also offers real-time monitoring of running processes, allowing a DBA to identify and "kill" runaway queries before they impact the system.
CH-UI: A more modern, Docker-ready interface, CH-UI is designed for quick data browsing and instance health checks. It is particularly useful for managing distributed clusters, as it provides native support for
ON CLUSTERoperations and visualization of distributed table structures.
Governance & Performance Validation
The final pillar of the ClickHouse village is governance. As clusters grow and hardware evolves, ensuring that the system is performing within expected industry standards is paramount.
ClickBench: The Performance Governance Check
ClickBench is more than just a benchmark; it is a governance tool that provides a comparative baseline for ClickHouse performance across different hardware configurations and software versions. It consists of 43 queries that test the limits of CPU, memory bandwidth, and storage throughput.
For a data engineer, ClickBench serves as a "sanity check" during the provisioning phase. By comparing the results of a local or cloud instance against the official ClickBench dashboard, one can identify if a particular cloud instance type or disk configuration is underperforming. The benchmark distinguishes between:
Cold Runs: Measuring the performance of disk I/O and the initial filling of the page cache.
Hot Runs: Measuring the execution efficiency of the query engine once the data is in memory.
This distinction is critical for setting Service Level Objectives (SLOs) for user-facing applications. If the "Cold Run" performance is unacceptable, it signals a need for faster storage (like NVMe) or a better caching strategy, regardless of how fast the CPU can process the data once it is loaded.
Conclusion
Building a successful ClickHouse platform in 2026 requires selecting the right tools for each stage of the data lifecycle. The "Senior Developer's Recommendation" for a robust, scalable, and manageable stack is as follows:
Development Environment: Utilize chDB for interactive Python-based exploration and Mockaroo for generating the synthetic data necessary to harden your schema and validate compression settings before deployment.
Ingestion Pipeline: Deploy GlassFlow to handle the real-time transformation, deduplication, and enrichment of Kafka streams. This ensures that your ClickHouse cluster only stores clean, optimized data and isn't bogged down by the computational overhead of background merges or complex joins.
Production Operations: Manage your cluster using the Altinity Kubernetes Operator. This provides the necessary automation for rolling upgrades, S3-based backups, and the migration to the more efficient ClickHouse Keeper for coordination.
Observability and Visualization: Implement HyperDX for a unified view of your logs, traces, and metrics. For administrative tasks and query tuning, keep Tabix or CH-UI in your toolkit for deep-dive performance analysis.
By adopting this "village" of tools, data engineers can move beyond the limitations of a standalone database and build a true analytical platform that is resilient, cost-effective, and capable of delivering sub-second insights at any scale. The standard of 2026 is not just about the speed of the engine, but the strength of the ecosystem that surrounds it.
Did you like this article? Share it!
You might also like


Data transformations at TB scale for ClickHouse
Get query ready data, lower ClickHouse load, and reliable pipelines at enterprise scale.
